🔥 The year-to-end crypto Santa rally?
The recent US CPI inflation data came in lower than expected and sparked a rally across the board. The CPI inflation data figures showed a faster-than-anticipated slowdown in consumer prices, leading to adjustments in expectations for future Federal Reserve Policy rates. October's CPI inflation was unchanged from the previous month, with core inflation also coming in slightly below expectations.
Contrary to market predictions, core inflation at 4% shows the downtrend has continued since March. Data suggests no immediate need for the FOMC to restart its rate-hiking cycle. The market reduced the likelihood of rate hikes in December and January, with futures showing no expectation of policy changes in these months.
Forecasts now predict a 1/3 chance of a Federal Reserve rate cut by March, with expectations of 2 cuts by July in money markets.
Despite inflation remaining above target, a pause in rate hikes doesn't mean rate cuts. The optimism extended to other markets with Treasury yields, especially in the longer-term bonds anticipating drops. After the CPI report, the 10-year yield fell by 15 points and the 30-year Treasury by 12. This does show uncertainty about the economy's future. However, it's questionable whether this single CPI report showing only a 0.1% improvement is enough to change perceptions about the permanence of inflation.
Interestingly, the Bureau of Labor Statistics (BLS) reported a year-over-year decrease in health insurance costs, which has contributed to the change in the Consumer Price Index (CPI). However, this decrease seems unrealistic, considering the current demographic trends and healthcare costs. The fall in health insurance costs is attributed to a BLS calculation method change.
Equity markets also rose in response to the anticipated lower yields, with the SPX500 gaining 1.9%. UK markets also reacted positively to their own softer CPI data, increasing bets on rate cuts by the Bank of England in 2024. UK's inflation slowdown is driven by lower services inflation.
Also, one war hedge is succeeding and another one has been failing
Btw, Buy Calls on WTI Oil (USO)
Ticker USO
Expiry 2024 April Strike $71
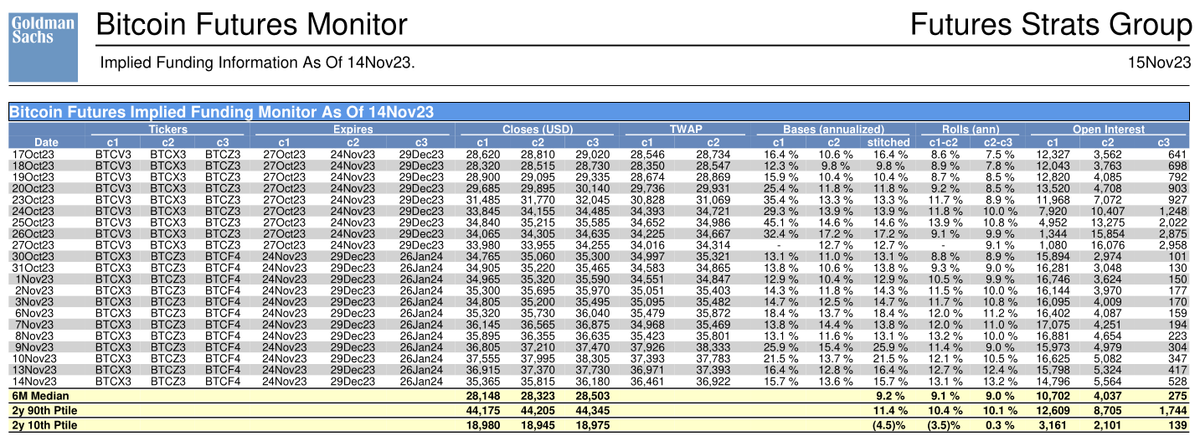
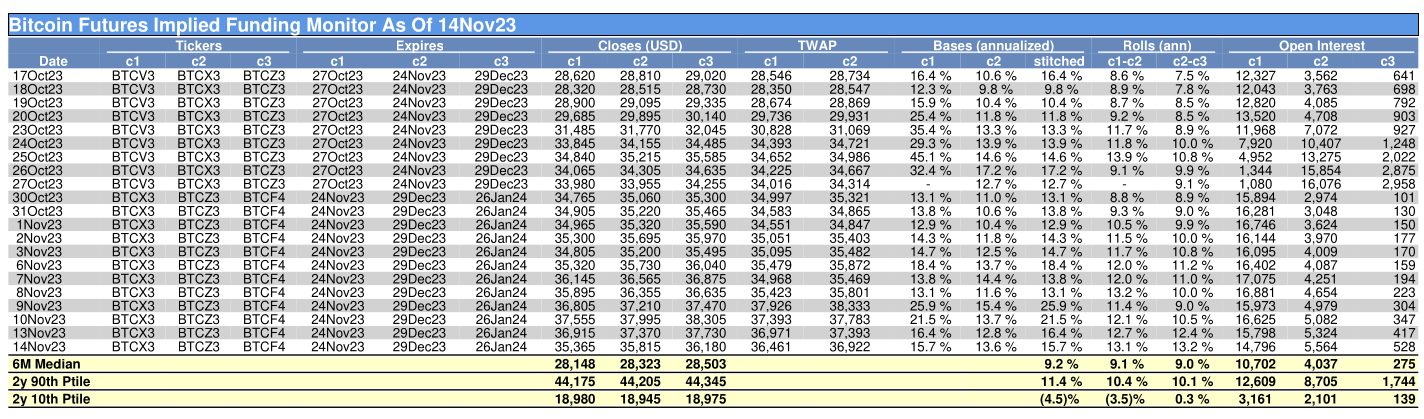
Bitcoin futures monitor
A quick rundown, forgive me for oversimplifying! I could write 30-minute articles about each subject but that would be too long for the newsletter.
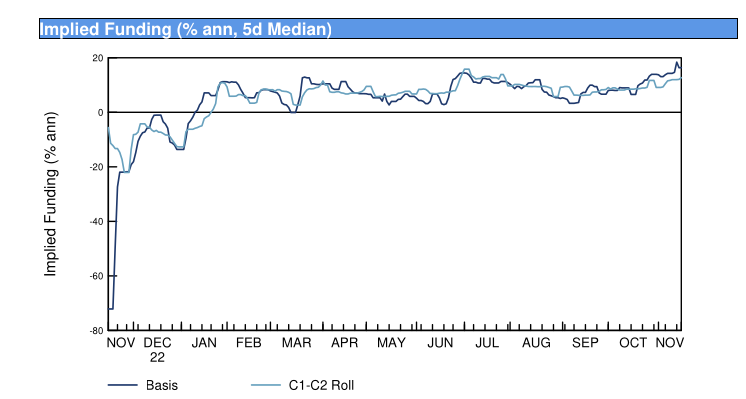
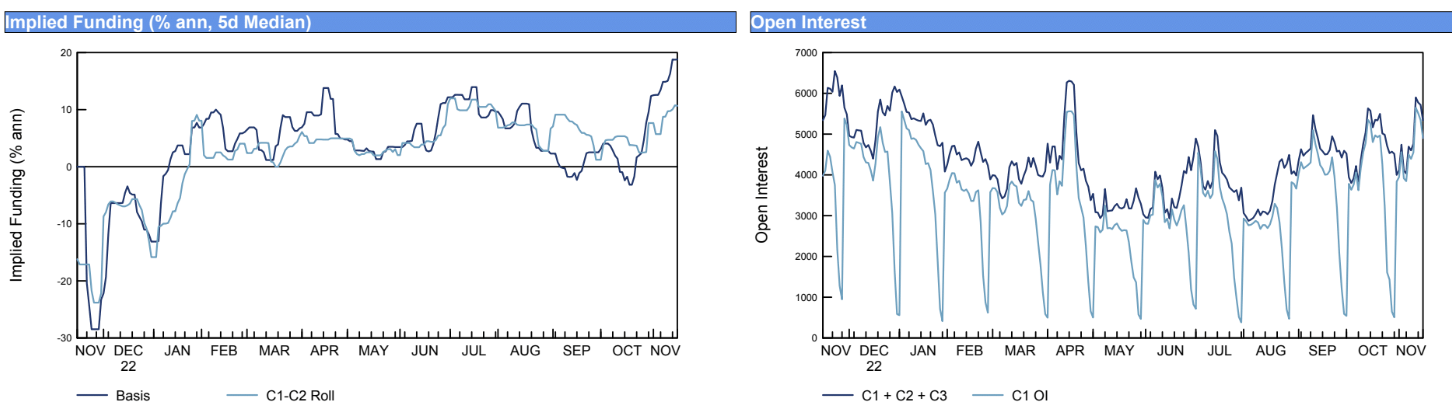
Implied funding rates and market sentiment
This shows a rolling median of implied rates, and these rates are an indication of the cost of holding positions in bitcoin futures markets. A positive implied funding rate usually indicates that long positions pay short positions and can usually be seen as bullish. Negative rates show a more bearish sentiment.
For example, if the implied funding rates were consistently high during this period, it's a sign of a generally bullish sentiment among market participants.
Closing prices and TWAP
The closing prices of different bitcoin futures contracts (BTCV3, BTCX3, BTCZ3, BTCF4) and their TWAPs might give us an insight into pricing behavior. Any notable divergence between the closing prices and TWAP can indicate market volatility or usual activity on specific days.
Consistency between the closing price and TWAP indicates a stable market, while significant variances suggest high volatility.
Open Interest trends
Open interest usually provides an understanding of how many future contracts are currently open and unsettled in the market. An increase in open interest (combined with price) is a sign of new money entering the market, usually a bullish sentiment.
A decrease in open interest indicates a contracting market, possibly bearish sentiment, or a lack of new entrants.
Annualized Basis and Roll rates
The basis rate (difference between future price and spot price) and the roll rates (costs of associated with rolling over a position) offer insights into market structure and sentiment.
A high annualized basis, a contango market, where future prices are higher than the spot prices, is often seen as a bullish market sentiment.
Low or negative basis rate, backwardation market, where future prices are lower than spot prices, often seen in bearish markets and bearish sentiment.
- Comparing the data points over covered period (17 October 2023 to 14 November 2023) can reveal potential trends, such as increasing or decreasing bullish or bearish market sentiment.
Now, let's get into the numbers
The closing prices for the tickers (BTCV3, BTCX3, BTCZ3, BTCF4) show notable fluctuations over the period. The closing prices for BTCV3 started at 28,620 USD on 17 Oct and fluctuated, reaching 35,365 USD on 14 Nov.
This shows we are in a volatile market. The increase in closing prices obviously shows a bullish trend.
The TWAPs for BTCV3 and BTCX3 also moved similarly. The TWAP for BTCV3 was 28,546 on October 17th and increased to 36,461 on November 14th. The consistent increase in TWAP with closing prices reinforces this bullish trend, showing interest and buying pressure in the futures market.
May god have mercy, talk about "funding rates" which CryptoTwitter seems to hate these days and everyone has it wrong according to everyone. My understanding might be completely wrong but anyways....
The implied funding rates were positive for months, trades were willing to pay a premium to hold a long position, a sign of bullish market sentiment.
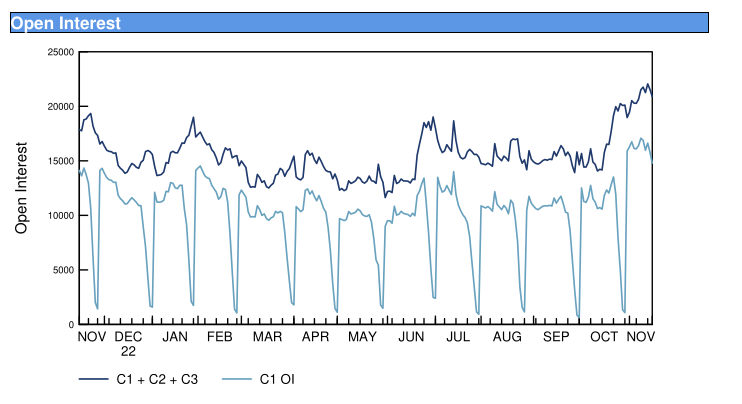
The open interest data varied for each ticker. For BTCV3 it started with 12,327 on October 17th and decreased to 14,796 on November 14th. For BTCX3, it was relatively lower, starting at 3,562 and increasing to 5,564.
The fall in open interest in BTCV3 may hint at consolidation or closure of positions as the expiry date comes closer. While the increase in open interest in BTCX3 signifies new positions being opened, traders most likely shifted focus to the new expiry date.
Rolls
The roll rates for contracts c1-c2 and c2-c3 varied. The c1-c2 rate increased from 8.6% to 13.1%. Increasing roll rates may show that traders were expecting price increases in the future and were willing to pay more for rolling over their positions.
Notes
Notes: Bases are based on spot and the futures 3-4pm London window, and Rolls are based on futures settlement prices. The stitched series takes c1 when greater than 10 calendar days to expire, else c2.
The implied funding chart shows a rolling 5-day median, and individual days or observations can be and have been greater in magnitude than shown in the chart.
Source: Bloomberg, Reuters and Goldman Sachs FICC and Equities, Futures Strats Group. Past performance is not indicative of future results.
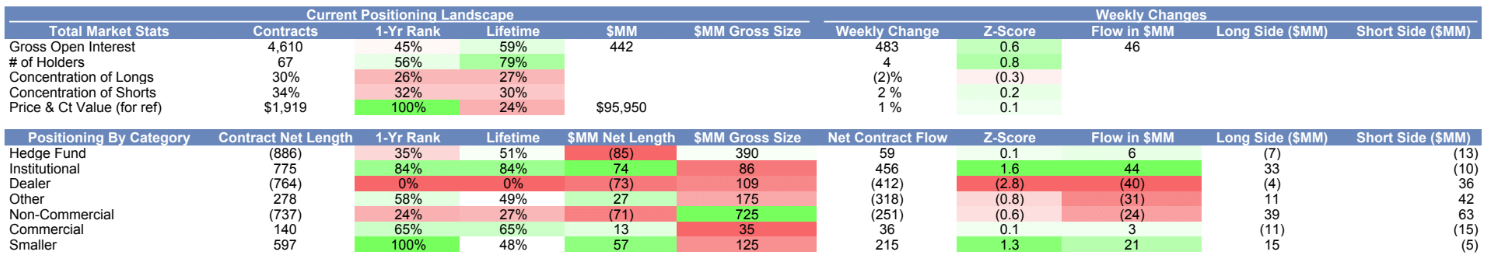
Bitcoin Positioning & Related Info
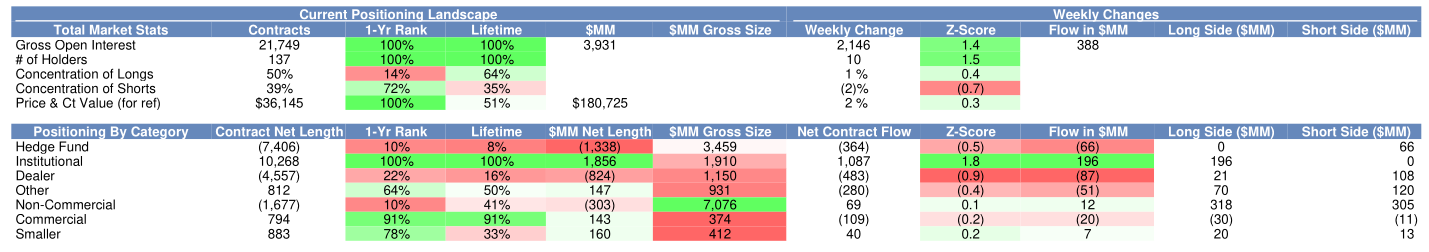
Total Market Stats
- Gross Open Interest: Total number, of open futures contracts, showing the level of market activity
- Number of holders: reflects market participation (If that's the right word)
- Concentration of longs & shorts: These percentages show how concentrated positions are among top holders, whether a few larger players dominate the market
- Price & Contract value: valuation of open contracts
Positioning by Category
Breakdown of the market participants into categories like Hedge Funds, institutional, Dealer, Other, Non-Commercial, Commercial, and Smaller traders, This shows which type of market participants are more active or dominant.
Current Positioning Landscape
- Contracts 1-year and lifetime rank: Shows the proportion of current open contracts relative to the highest number ever recorded. Shows whether the market is at historically high level of activity.
- Contract Net Lenght: Reflects the net position (long or short) held by different categories of traders. Negative numbers show a net short position, while positive numbers show a net long position.
Weekly changes
- Net Contract Flow: This shows the net change in contract positions, and shows if traders are adding or reducing their positions.
- Z-Score: Statistical measure of how current positioning 'deviates' from the historical average, which can indicate if we are at overbought or oversold conditions
- Flow in $MM: Shows monetary value changes in long and short positions. Gives insight into how aggressive the different categories are in changing their positions.
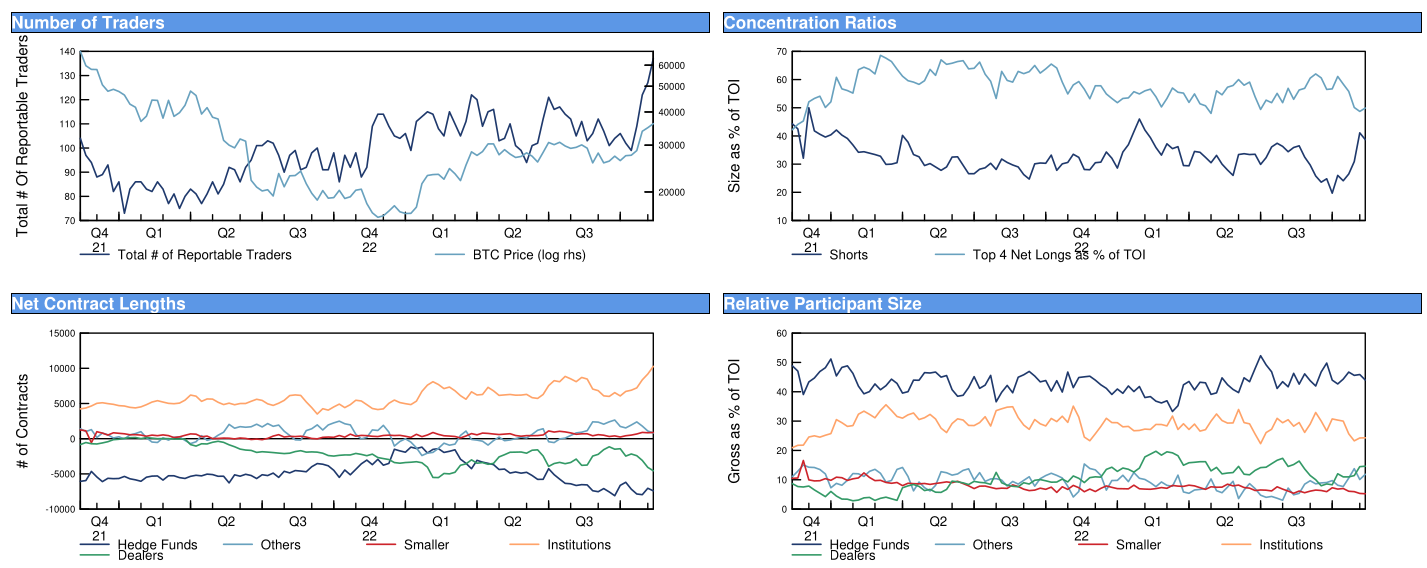
** High concentration in longs or shorts among top holders might be a risk for price manipulation opportunities.
Now let's get into the numbers
Total Market Stats
- Gross Open Interest: 21,749 contracts --> solid market activity.
- Number of holders: 137 holders --> moderate level of market participation
- Concentrated longs and short: Longs were concentrated at 50% while shorts at 39%. A higher "slightly" higher concentration of bullish positions
Positions by category
- Hedge Funds: Net short position of 7,406 contracts, you could claim this is bearish but hedge funds are supposed to hedge with futures anyway, so it makes sense if the market is in contango.
- institutional: Net long positions of 10,268 contracts, bullish sentiment among institutional traders
- Dealers: Net short position of 4,557 contracts, bearish sentiment.
Current Positioning Landscape
- Hedge funds and dealers showed a net short position.
- Institutional, Commercial, and Smaller categories showed net long positions.
1-Year Rank
- The net positions of institutional traders were at their highest for the year, with bullish sentiment.
Weekly changes
Net Contract Flow:
- Hedge funds reduced their positions by 364 contracts.
- Institutional traders increased their positions by 1,087 contracts, reinforces their bullish sentiment and stance.
Z-Score:
- A Z-score of 1.5 for institutional shows their position is way above the historical average, hinting at perhaps an overextended bullish sentiment.
The high net length in Institutional and Commercial categories may indicate anticipation of price increases or a hedging strategy against spot market volatility.
The increase in Institutional positions in contract flows may reflect a market response to recent events or data impacting Bitcoin's outlook.
Notes
Notes: Converted to dollars based on price of (front) futures as of the last CFTC date; 1 contract = 5 Bitcoin. Start date for Lifetime range is 10-April-2018.
1-Yr and Lifetime rank is based on contracts by default (not dollars or TOI normalization), and same for Z-Score (Z-Score uses last 1-yr time range and 0 mean).
Concentration ratio is shown as top 4 biggest net longs, and shorts, as a % of total open interest (the higher this # the more concentrated and less broadly the mkt is owned).
Units are as shown in the column headers except where otherwise noted (like # holders, % contentration or $ price).
Hedge fund = leveraged category and Smaller = non-reportable category. Long and short change columns are ex spreads.
The above uses the futures-only dataset by default (rather than the combined dataset with options).
Source: CFTC, Commodity Systems Inc. and Goldman Sachs FICC and Equities, Futures Strats Group. Past performance is not indicative of future results.
Become a Premium member. Premium newsletters & Discord community access
ALSO, THE ARTICLE DOES NOT END HERE
Join Discord to get the full value out of the newsletter. There's no extra cost associated with Discord. Yes, options data, such as dark pools, options gamma, unusual flow, etc., are also included. Also, educational content, reports, and direct questions to me, and often, I share my trades & thoughts in real-time as the market moves.
However, I want you to understand rather than copy a trade.

Become a premium member. Besides crypto, if you cashed out a lot or are planning to. I highly recommend "stocks" section for long-term plays.
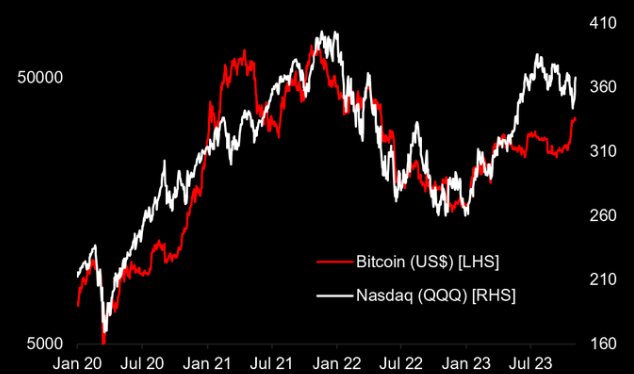
The year-to-end bitcoin Santa rally?
A bit of chart crime but does look like Bitcoin has some catching up to do to NASDAQ.
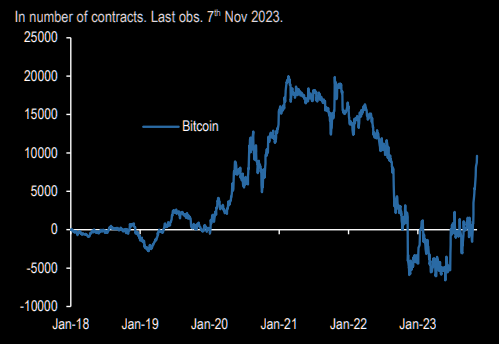
Is the institutional bid back?
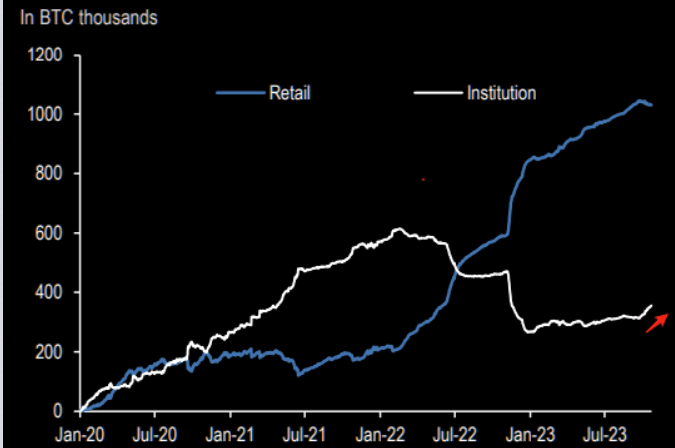

JPM's proxy based on open interest in Bitcoin futures has surged.
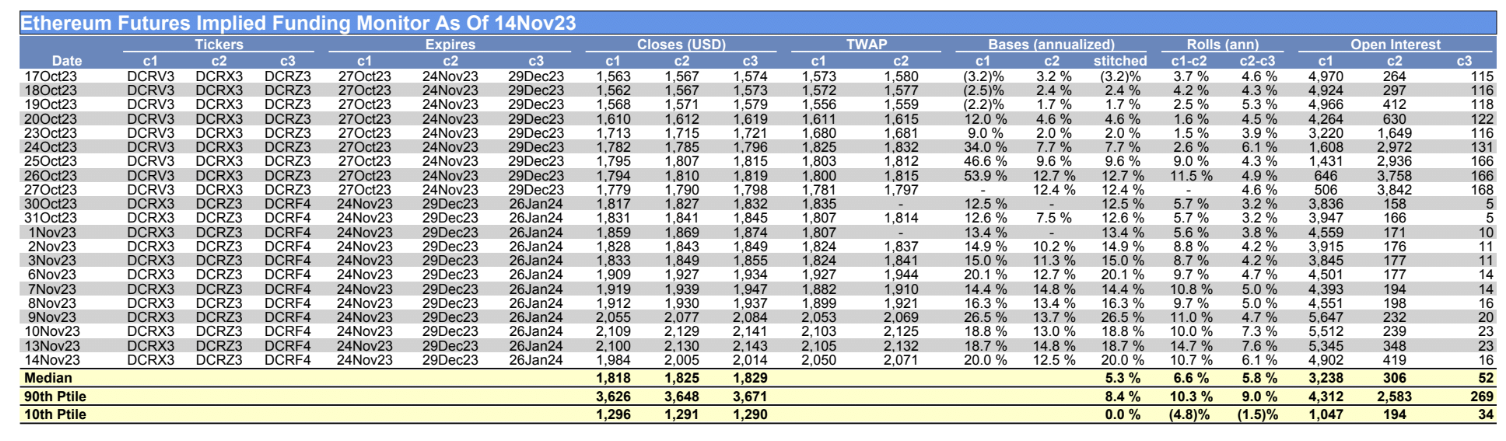
Ethereum futures monitor
Now you've seen me break it down, you can try to break down ethereum futures yourself.
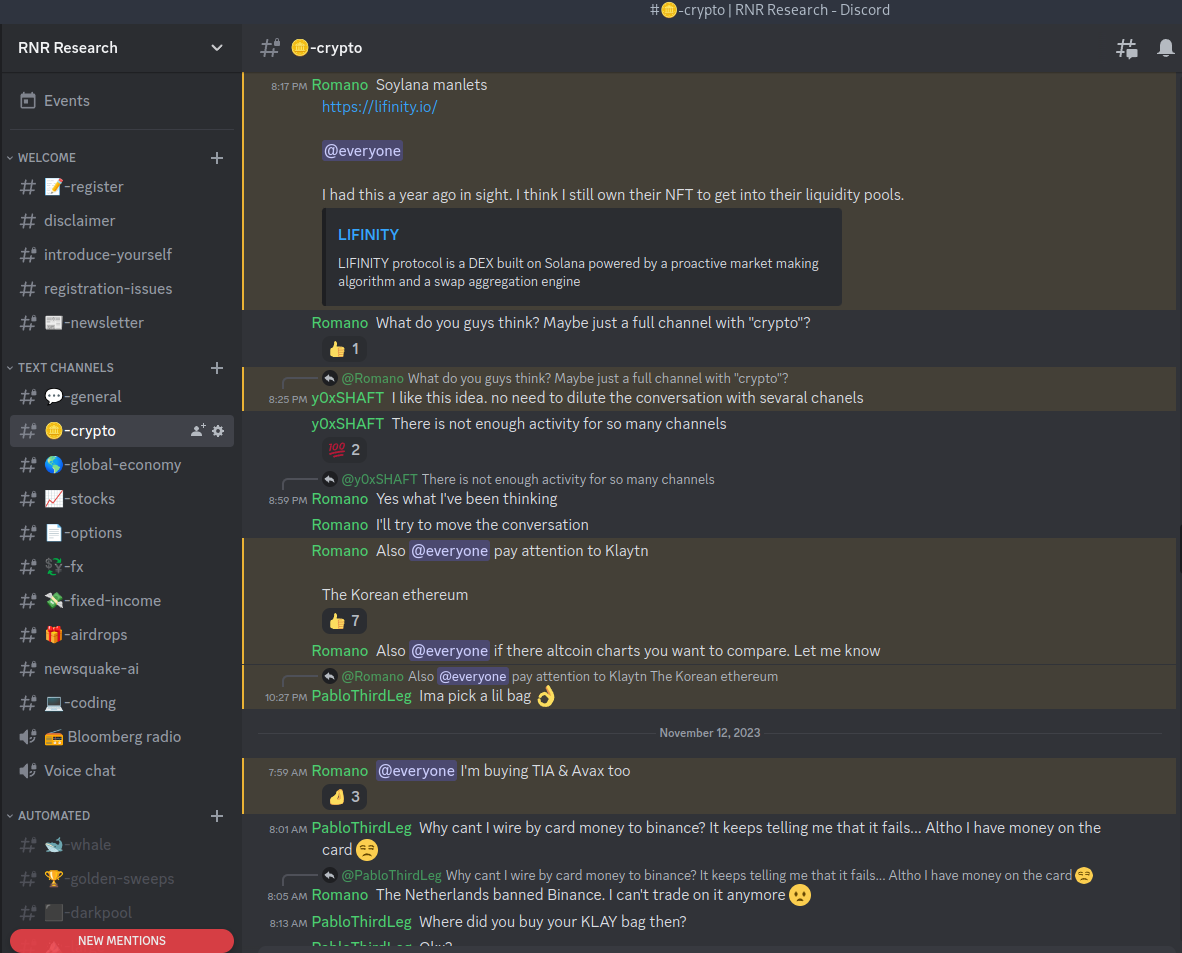
Klaytn, the Korean Ethereum
Klaytn blockchain is like a secure blockchain open for anyone to use and build web-based stuff like apps and services.
Klaytn is user-friendly and efficient. It's designed to handle lots of transactions quickly keep costs low for those running apps on it, and make it easier for businesses to get in.
Klaytn has 3 main parts.
- Core Cell Network: This is where all the transaction processing happens
- Endpoint Node Network: Creating transactions and handling requests
- Service Chain Network: It's like a mini-blockchain run by different apps connected to the main Klaytn blockchain.
Klaytn has its own token called KLAY. The system doesn't just reward the big guys running the network but also supports a variety of participants who help grow Klaytn.
When a new block is created, new KLAY tokens are made and handed out in 3 slices.
- Governance Council Reward: Those who maintain the network.
- Community Fund: For projects that make Klaytn better and more transparent.
- Foundation Fund: For future growth and projects on Klaytn.
Kakao Corporation, a leading internet company in South Korea, created Klaytn. It is deeply ingrained in the country's tech ecosystem, and as a result, it has a significant presence there. This strong local connection is why its sometimes dubt as the "Korean Ethereum"
🗣️📣 $KLAY is Korean Ethereum https://t.co/5U3zkWa8wO pic.twitter.com/r1XCNdT1VW
— Romano (@RNR_0) November 12, 2023
The current chart of KLAY looks like this
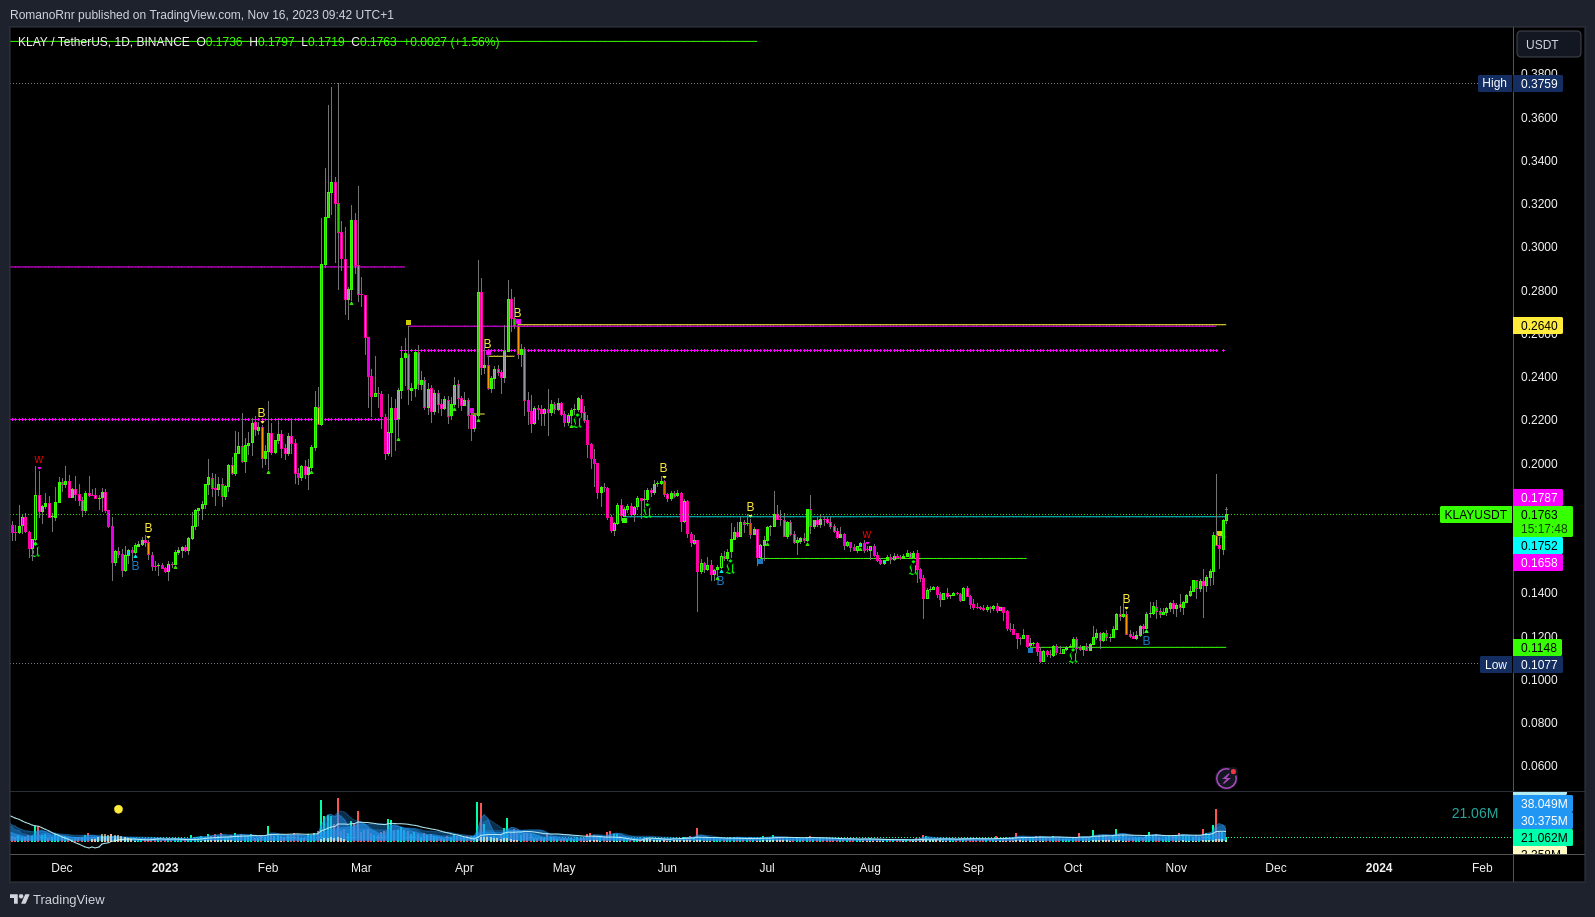
However, charting against the dollar gives a distorted view. We need to chart against BTC to see if there's real strength since we try to outperform BTC
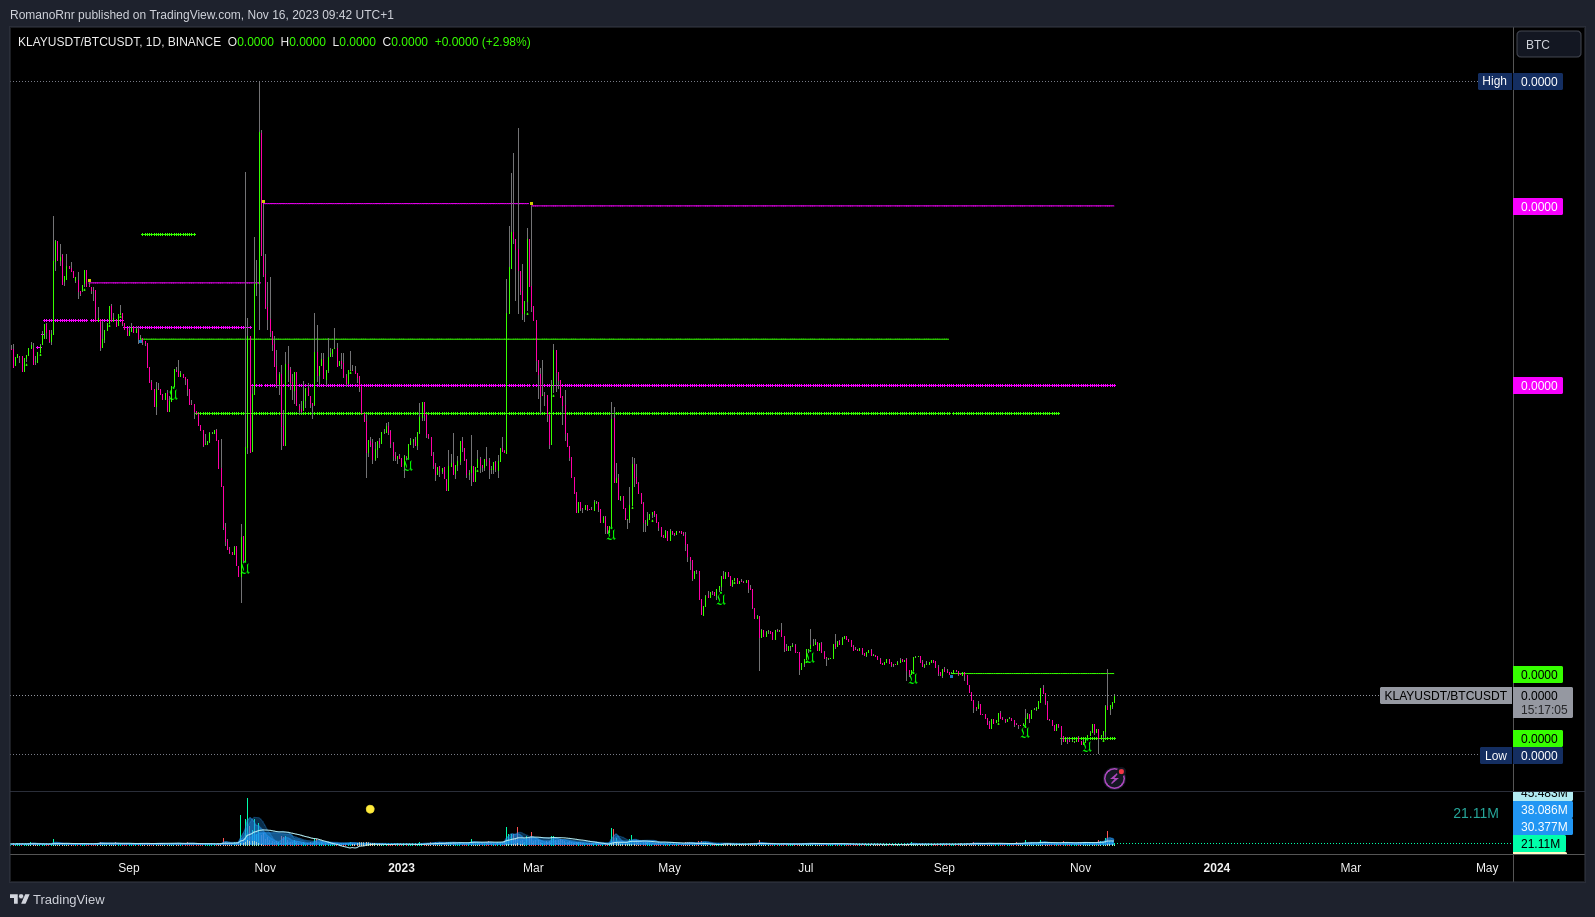
It has some more room to grow
Become a Premium member. Premium newsletters & Discord community access
Join Discord to get the full value out of the newsletter. There's no extra cost associated with Discord. Yes, options data, such as dark pools, options gamma, unusual flow, etc., are also included. Also, educational content, reports, and direct questions to me, and often, I share my trades & thoughts in real-time as the market moves.
However, I want you to understand rather than copy a trade.
Become a premium member. Besides crypto, if you cashed out a lot or are planning to. I highly recommend "stocks" section for long-term plays. No leverage, just spot for the "stocks" section.
Celestia
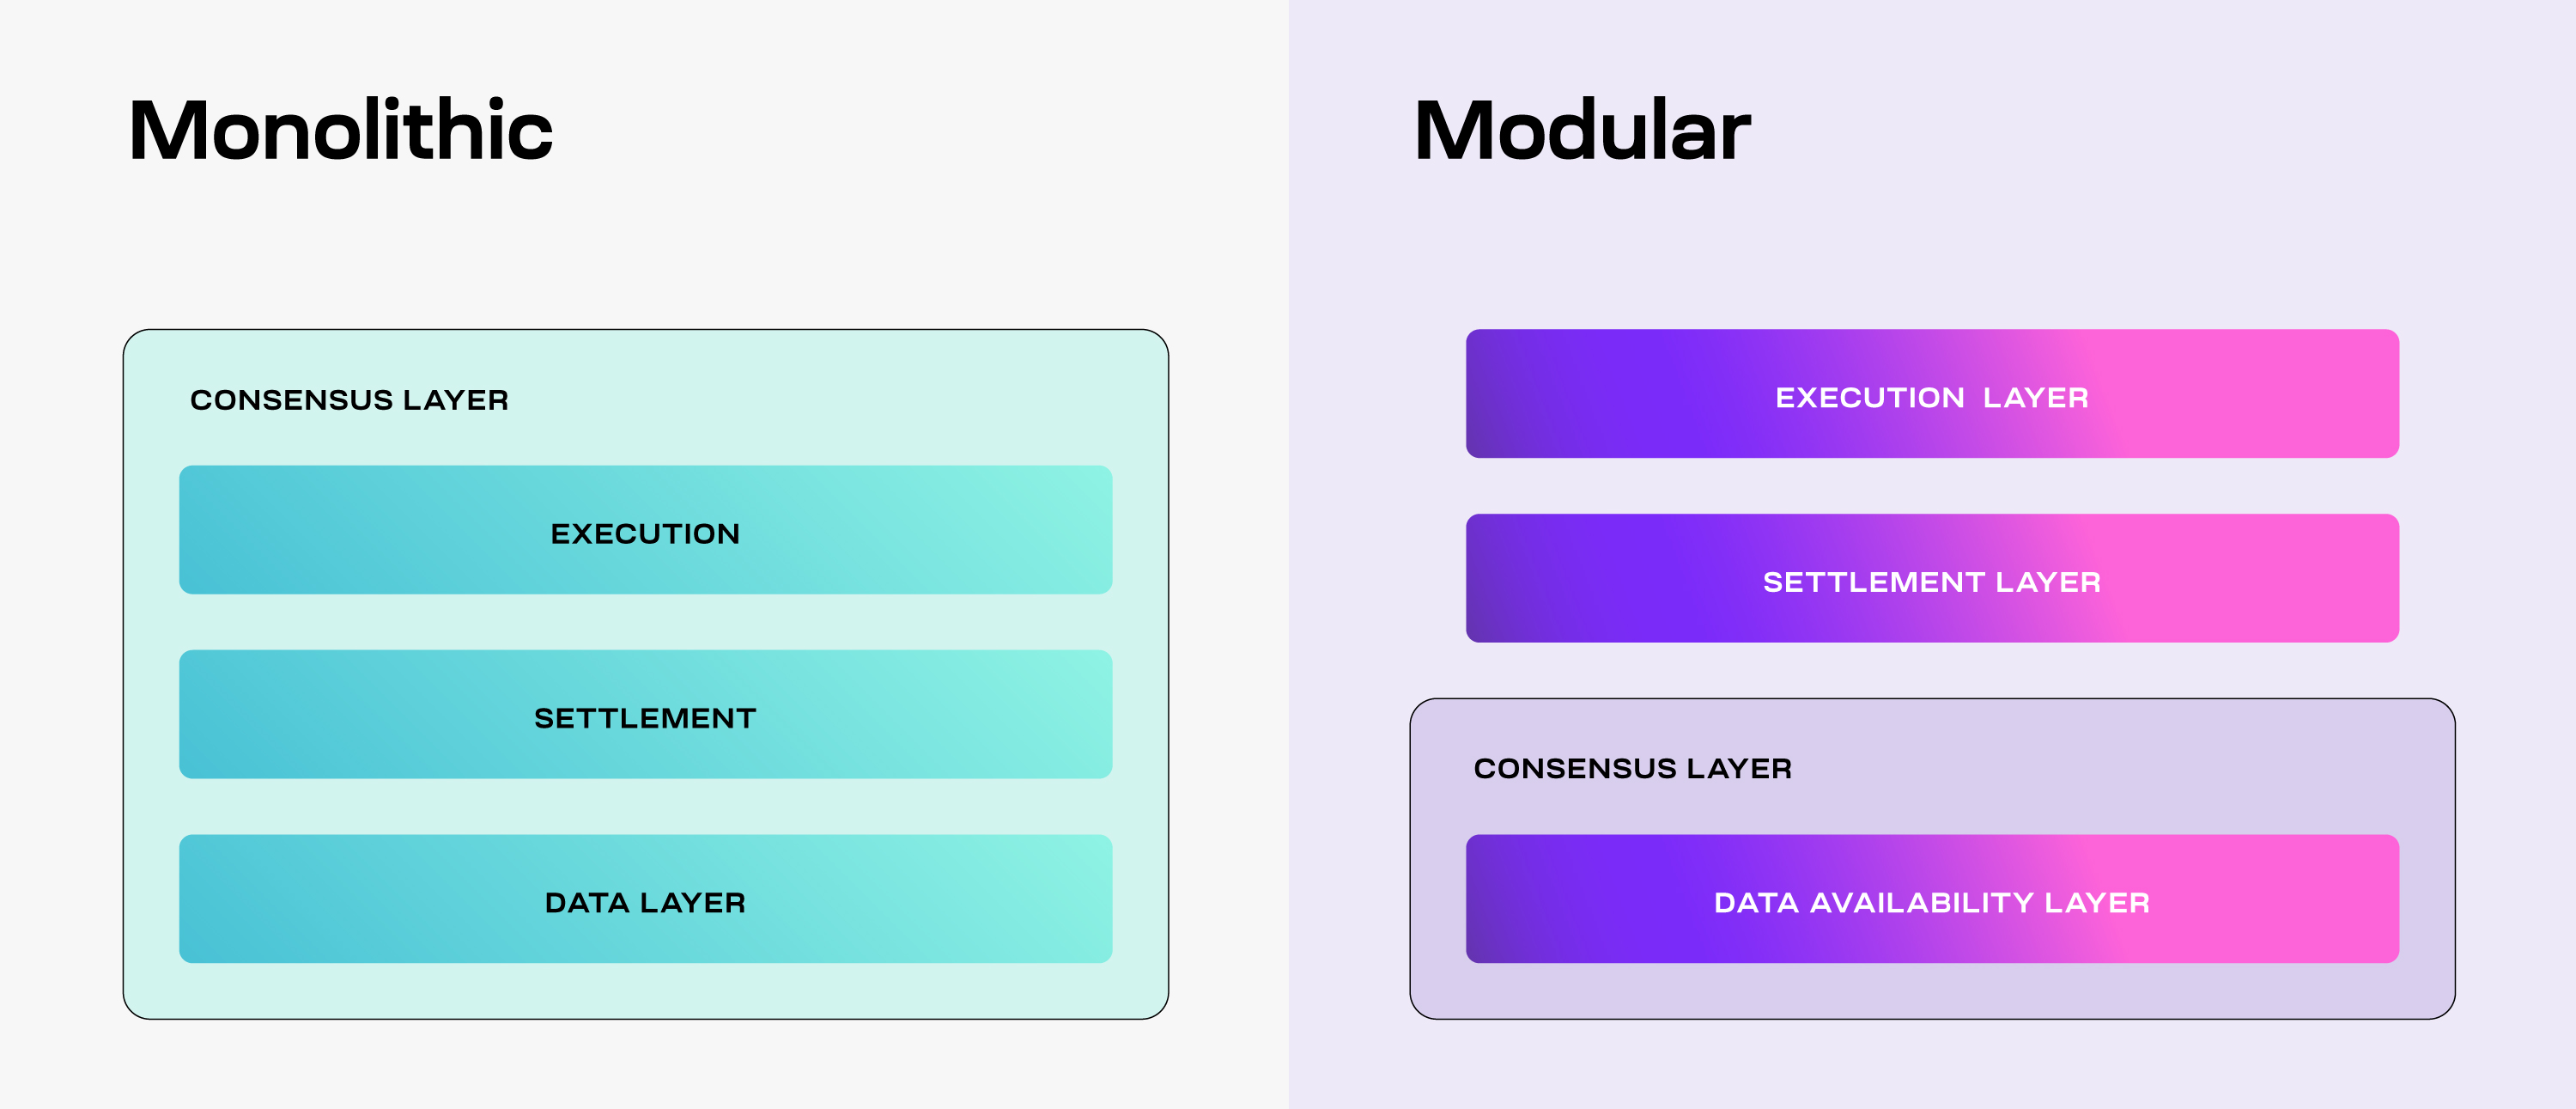
Celestia is a pioneering modular data availability network designed to scale with increasing users securely. This network simplifies the process of launching a blockchain, making it as straightforward as deploying a smart contract. Celestia stands out as the first network of its kind, focusing on modular blockchain technology.
That's a nice marketing text, but it's a bit vague, so let's break it down.
Imagine blockchain technology like building a massive Lego structure. Traditional blockchains like trying to build this huge structure at once. It's heavy, and you need to check every piece to ensure it fits perfectly. This is where Celestia comes in.
Instead of one giant Lego structure, why don't we make smaller, separate pieces and link them together? This is what they mean by a "modular" blockchain. It's all about breaking the big blockchain into smaller, more manageable pieces. (I am oversimplifying this, but you get the point)
Celestia seems to focus on a few things
- Ordering transactions: Think of this as organizing all Lego pieces in the right order before you start building
- Data availability: This is like ensuring all the Lego pieces are on the table and easy to find when needed.
An interesting concept is "data availability sampling", think of it like instead of checking every single Lego piece to make sure it's there (which takes forever), you just randomly check a few pieces. If they're good, you can be confident the rest are too. This makes the whole process faster and less heavy.
The more people who join in and check these random pieces, the bigger and more complex the blockchain can get without slowing down. Celestia can grow.
Also, Celestia is like the foundation layer, letting others build different types of chains on top of it. Imagine building different themes Lego sets (like castles, spaceships etc) on a baseplate.
Blockchains can get complex and slow because all the data and transactions need to be verified. Celesia simplifies this process, making building and maintaining blockchains easier and faster. This can help in making blockchain technology more accessible and scalable.
However, there are some concerns, and I might be wrong about it.
The efficiency of data availability in Celestia heavily relies on the participation of nodes. If the network doesn't have enough participants, the reliability of this sampling could be compromised.
Modulair blockchains like Celestia aim to improve scalability, but there's often a trade-off between scalability and security. While breaking down tasks into smaller chunks (modules) can improve performance, it might introduce new attack vectors or points of failure.
Although Celestia simplifies launching a blockchain, the concept of modular blockchains and data availability sampling remains complex. This complexity could be intimidating for novice users or developers new to blockchain, limiting accessibility.
Celestia is entering a space with well-established players and numerous emerging technologies. It is a considerable challenge to gain a significant foothold and convince developers to adopt its platform over others.
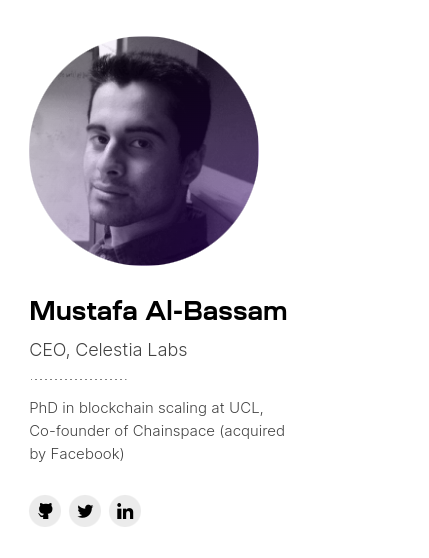
Interestingly, the CEO Mustafa is the ex-member "golden child" of hackersgroup LULZSEC. While being "caught," he didn't rat out other members of the group.
Video documentary
Now Celestia's token is called TIA
The TIA token plays a central role in Celestia's ecosystem, offering several functionalities within this modular blockchain network:
- Total Supply and Inflation: At Genesis, the total supply of TIA is set at 1 billion tokens. It has an inflation schedule starting at 8% in the first year, decreasing by 10% each year until it reaches a floor of 1.5% annually. This design aims to manage the token's availability and value over time.
- Role in the Ecosystem: TIA serves multiple purposes:
- Paying for Blob Space: Developers use TIA to pay for data storage on the network. When they need to store data (in blobs), they pay using TIA. This system is crucial for Celestia's data availability functionality.
- Bootstrapping New Rollups: TIA can be used as a gas token and currency, similar to ETH in Ethereum-based rollups. This lets developers start their projects quickly without creating a new token immediately.
- Proof-of-Stake: Celestia, built with Cosmos SDK, uses a proof-of-stake mechanism. TIA holders can participate in securing the network by staking their tokens with validators earning rewards in return.
- Decentralized Governance: TIA stakers also engage in the network's governance, voting on proposals and managing the community pool.
- Denominations: TIA has smaller denominations for staking and transactions:
- utia: Known as "micro TIA," where 1 TIA equals 1,000,000 utia. It's used as the native staking denomination.
- microtia: An alias for utia, used in similar contexts.
In Celestia, TIA is a multi-functional asset that supports the network's economic and governance structures. It incentivizes participation and ensures smooth operation.

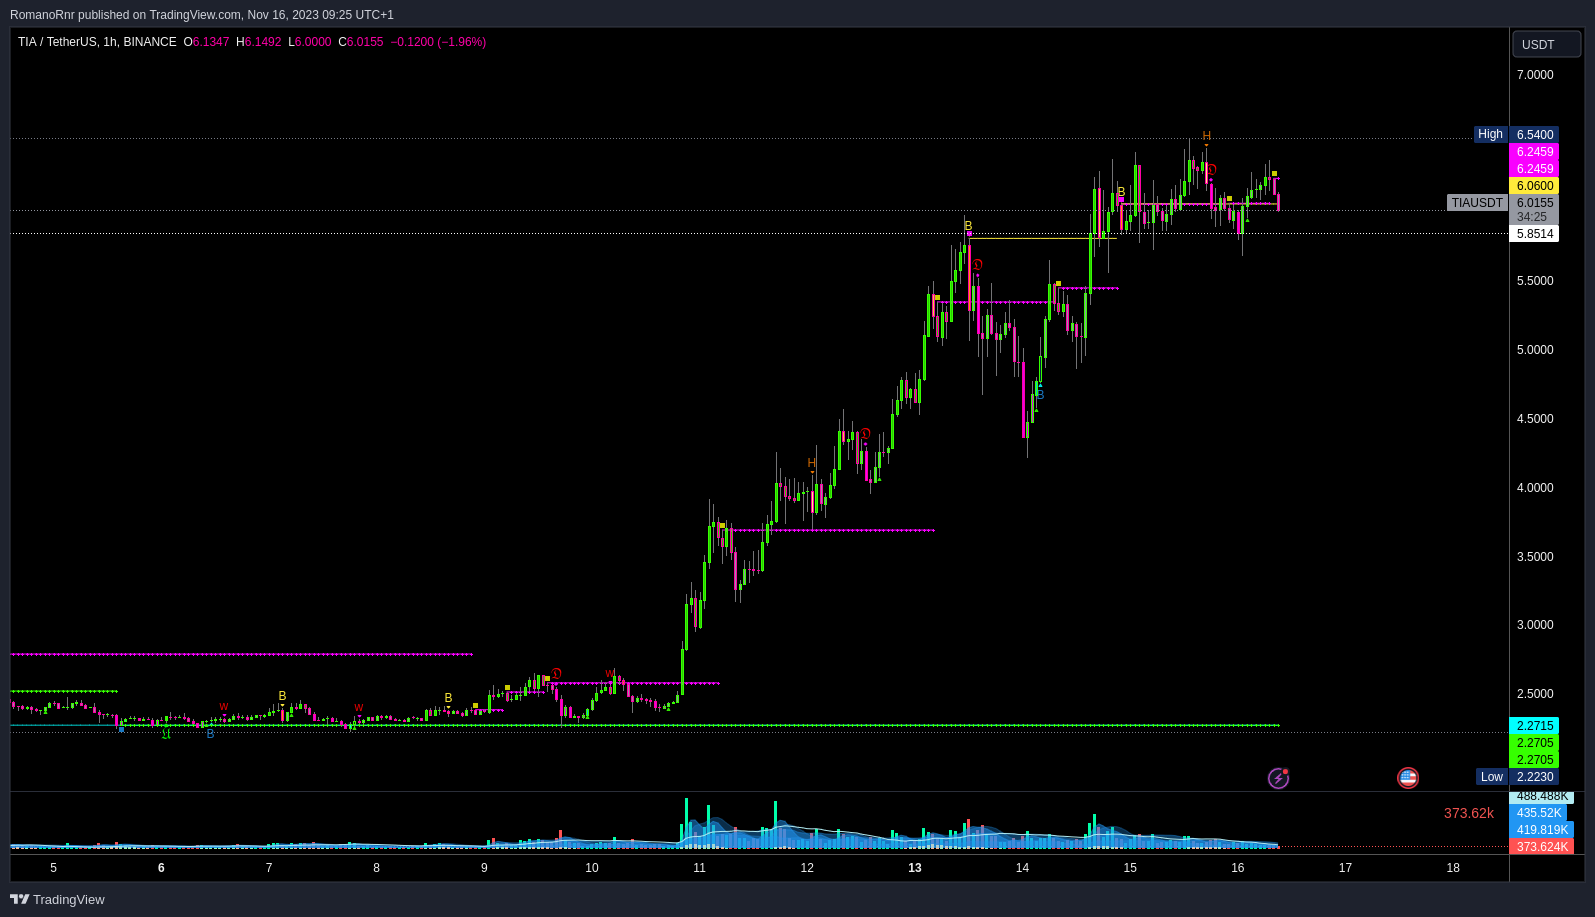
I mentioned on Twitter to buy $TIA days ago multiple times, price did go up a lot.
I'm turning my brain off
— Romano (@RNR_0) November 11, 2023
It's stupid time$TIA is somewhat interesting. I'm doubtful of the token economics but the aping of the crowd can potentially set off emission
It still didn't kick in yet https://t.co/bc3X625VIl pic.twitter.com/iA3T3RHOV9
$TIA up 30% https://t.co/yM55ii6xBF pic.twitter.com/6IJOB95WD1
— Romano (@RNR_0) November 13, 2023
Now, charting against the dollar gives a distorted view, so let's try BTC
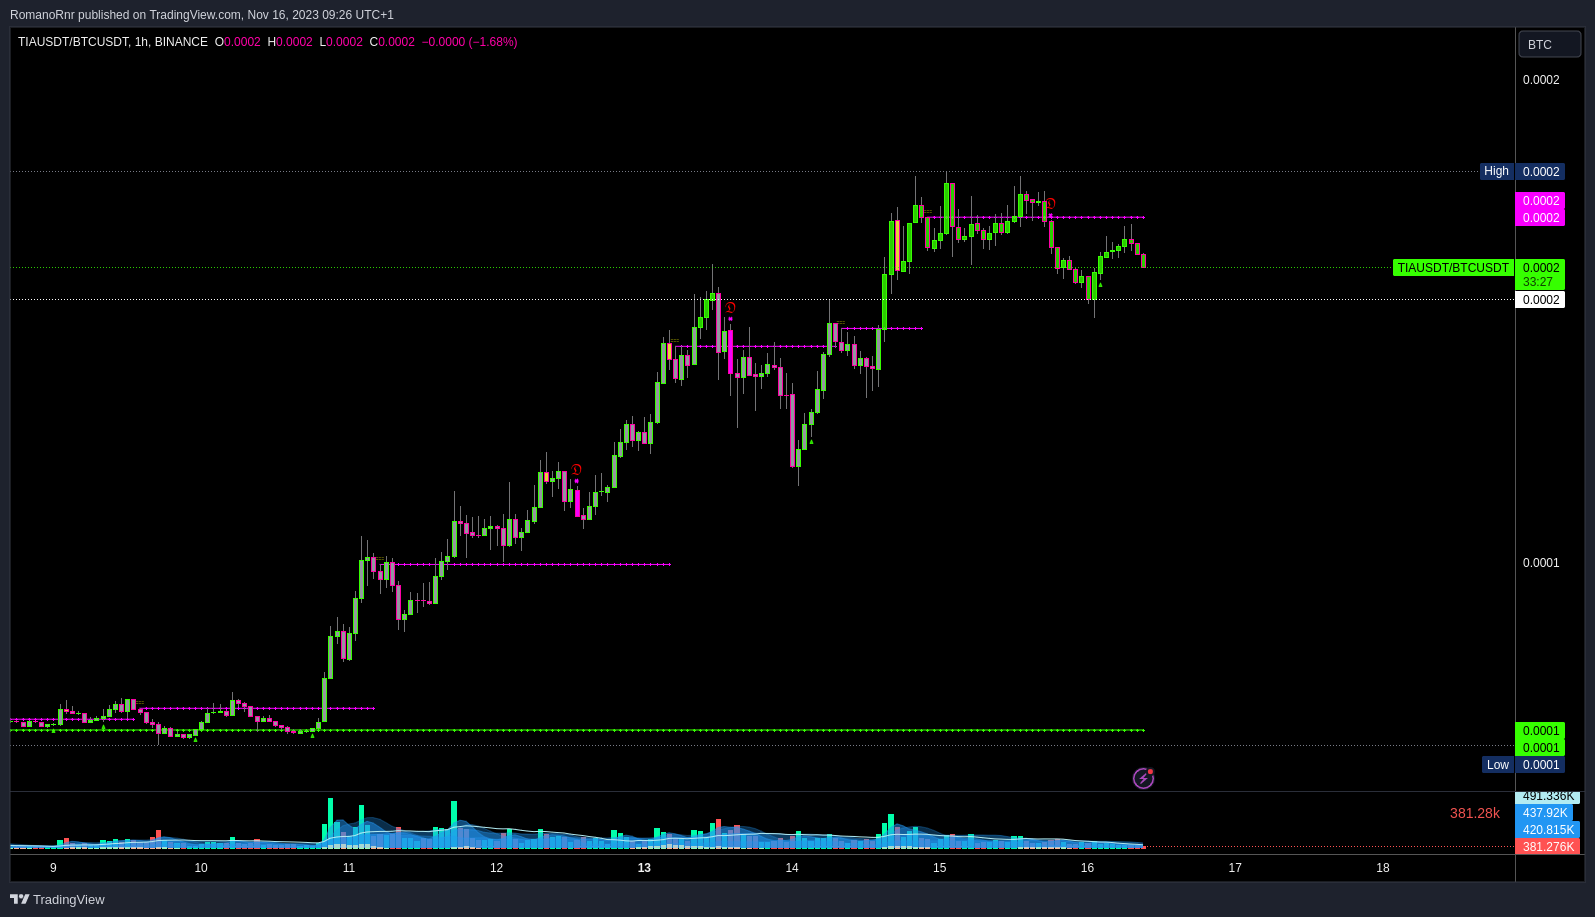
It's still been going up against BTC, that's good. We are trying to outperform BTC.
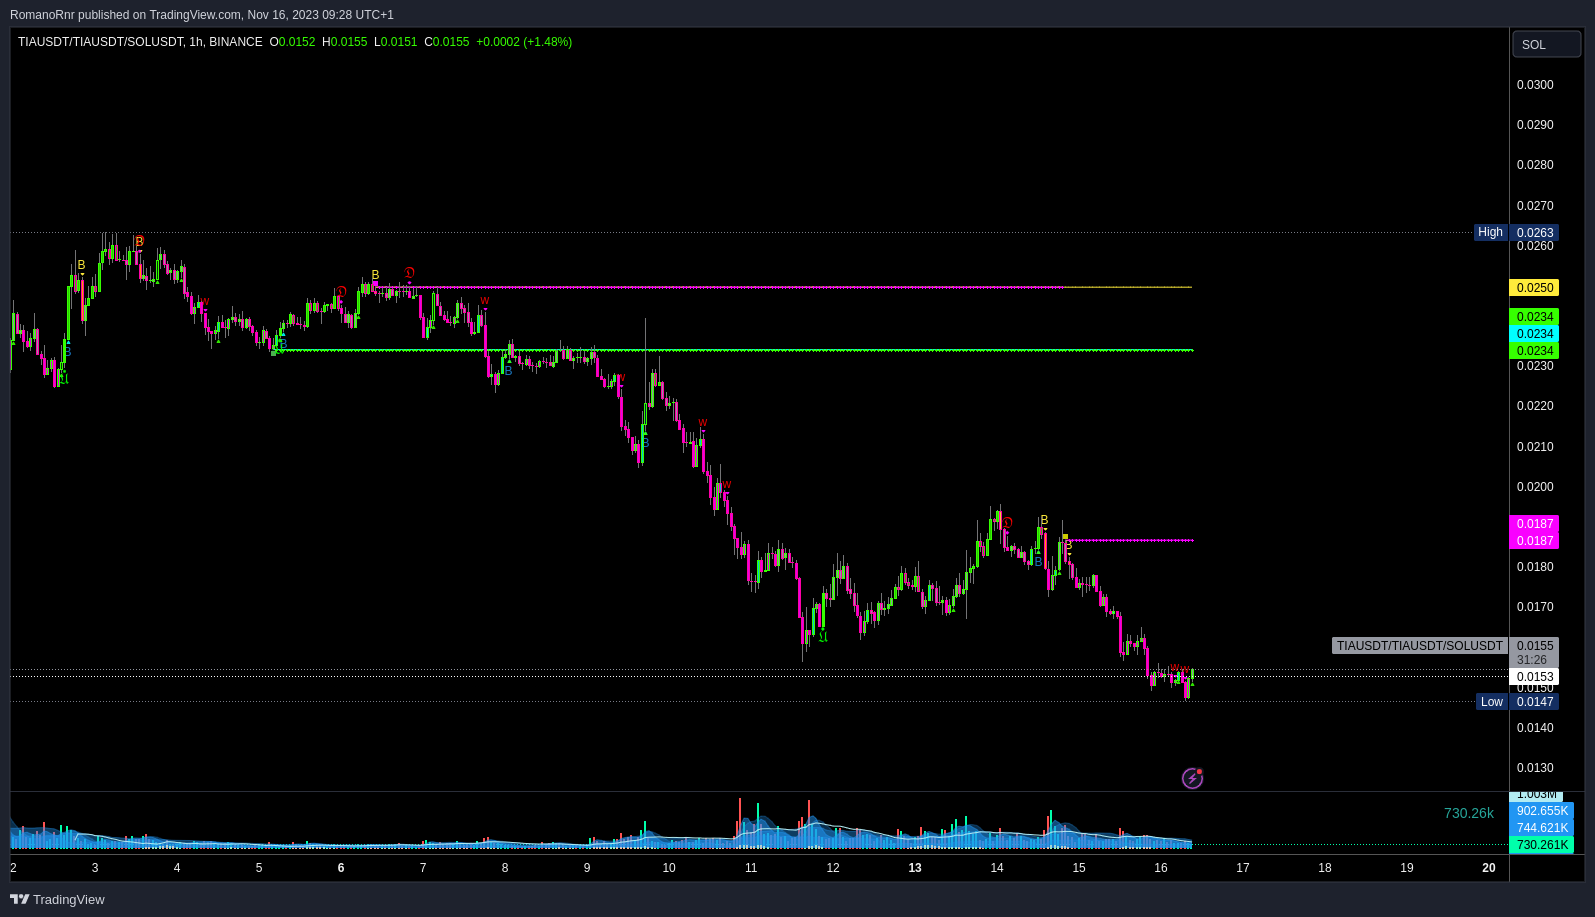
I would like to see at what point it will outperform Solana, so let's chart against Solana.
ApeX DEX
ByBit has made KYC mandatory as many other exchanges. Why not try out ApeX DEX? You can use your wallet or social account to use the DeX. No gas fees are required for trading & the fast trading experience is like a CEX.
Consider ApeX DEX
By the way, ApeX added a lot more altcoin futures such as Celestia $TIA
Instructions:
https://twitter.com/RNR_0/status/1652360705331347461
For a lifetime fee discount, check the link.