The BTFP Liquidity Drain

Before moving on to crypto, let's start with the situation in the Middle East, especially the Red Sea crisis, which is getting more tense every day. Imagine solving a water shortage by dumping more buckets into the mix when there's a tank leak. That's kind of what's happening economically with attempts to boost demand in the face of supply issues.
Also, some key events that have happened
- JPMorgan believes that the futures market's momentum, driven by momentum traders like Commodity Trading Advisors (CTAs), may lead to mean reversion for gold and bitcoin due to the current extreme levels of momentum indicators.
- President 'Boden' lifted $10 billion in sanctions on Iran right after the US hit back at Iran's forces for an attack that killed three US soldiers.
- Russia reiterated again that they will use nuclear weapons while Ukraine's drones are busy taking out Russian military spots inside Russia. They're not stopping at military factories but also hitting oil refineries. You have to wonder when the markets start panicking (They haven't yet).
- The American public is still unsure of where Russia is since three different maps are circulated. God bless America.
- The ECB is making some changes. They're planning to keep a bunch of strategic bonds, including those from the European Investment Bank (EIB), which might soon start pouring money into the EU defense sector. The EIB is aiming for 60 billion euros, and they could even push it higher,
- Japanese stocks are at risk of profit-taking due to the possibility of a policy change by the Bank of Japan.
- There's potential for momentum traders to establish more short positions of yen if the Bank of Japan (BoJ) changes its policy in the upcoming week.

The US Bank Term Funding Program (BTFP) has recently ended. However, this move did not cause an immediate crash. On the other hand, there has been a significant rise in the Federal Reserve's overnight repo balance, which surged from $445 billion to $522 billion in just two days.
Janet Yellen, the US Treasury Secretary, has expressed her opinion that interest rates in the United States are unlikely to return to the levels seen before the pandemic. Recent statements and forecasts support this viewpoint. For instance, this year's average three-month rate is expected to reach 5.1%, up from the earlier prediction of 3.8%. Similarly, the forecast for the 10-year yield has been revised upward to 4.4% from the earlier predicted 3.6%.
The Liquidity drain
Imagine the US banking system as a giant water tank. This tank has been pretty full over the past year or so due to a lot of "water" (money) flowing in from different sources. There's a change coming that's expected to siphon off $600 billion from this tank. Now, you may wonder what's behind this drain.
First up, we've got Treasury bills or T-bills for short. Think of T-bills as short-term IOUs from the government. Lately, fewer of these IOUs are going around, which is a bit like turning down the tap that fills our water. Then, there's the Bank Term Funding Program (BTFP), a special program that's been like a hose pumping water into our tank, offering low-cost loans to banks, but those are getting turned off.
Let's not forget about Quantitative Tightening (QT). If T-bills and the BTFP are about how much water is coming in, QT is about actively scooping water out of the tank. The Federal Reserve—you can think of them as the water management team—is pulling out $95 billion every month to keep the economy from overheating.
Despite these efforts from the Federal Reserve, the stock market has been hitting new highs, which may seem odd, but there are some good reasons behind it. Consumers happily spend money on companies, companies make profits (strong consumer spending), and everyone is obsessed with AI, which might turbo-boost tech companies. One reason for the market's success is the excess cash in the US banking system, leading to ample funds for investments in new and exciting trends.
However, this financial safety net that has cushioned the economy since early 2023 is about to get thinner. With fewer T-bills to invest in, money that would normally help fill our tank is heading elsewhere, like the Reverse Repo Facility (RRP). Basically, it's being parked in a safe spot at the Federal Reserve, but it tightens up the amount of cash banks have on hand. With the BTFP ending and QT in full swing, we're looking at a large drop in our financial liquidity tank by the time summer rolls around.
So what does this mean for us? With less money floating around, it's definitely less positive, and stocks might feel the impact. Just like when the water levels drop, boats might have a harder time sailing smoothly.
Balance sheet
Imagine you're trying to manage a household budget, but instead of groceries and rent, you're dealing with billions on a colossal scale. That's what the Federal Reserve does with the balance sheet.
Until 2021, the Fed's financial obligations (or liabilities side of the balance sheet) were mostly sash, The treasury General Account (TGA), basically the government checking account, and bank reserves, which is the bank's own savings account held at the Fed.
Despite our love for online payments, we still cling to paper cash. The amount of physical money in circulation grows in line with the economy's GDP.
The Treasury General Account (TGA) likes to keep a certain amount in its account, aiming for around $750 billion. They adjust this amount by selling or redeeming T-bills throughout the year. When they hit the debt ceiling (self-imposed limit), they spend down this account to pay bills. Once the ceiling was raised after a lot of political drama for nothing, they sold more debt to refill their coffers. These moves directly affect how much money banks have stashed at the Fed.
Bank Reserves are leftovers or residuals in the Fed's balance sheet. When the TGA goes down, bank reserves go up, and vice versa. This affects things like credit and the money market.
Reserve Repo
In 2021, the fiscal stimulus and pandemic lockdowns increased savings, resulting in a large amount of cash flowing into banks and money market funds (MMFs). MMFs are similar to savings accounts but invest in safe assets such as government bonds. Following some regulations implemented in 2016, these funds are now primarily restricted to government-issued securities. Due to the high issuance of T-bills by the government to cover pandemic spending, MMFs had ample opportunities to invest.
As the COVID-19 pandemic improved and the government's need for short-term cash reduced, the number of Treasury bills (T-bills) in circulation started to decrease. This put money market funds (MMFs) in a difficult position as they struggled to find enough T-bills to invest in, which led to a significant drop in interest rates. To address this issue, the Federal Reserve opened up the Primary Dealer Credit Facility's (PDCF) overnight lending program to MMFs, allowing them to park their excess cash there. This move helped stabilize the situation without flooding the market with too many T-bills.
However, there was a caveat to the situation. The influx of money into the PRP from MMFs started to displace bank reserves on the Fed's balance sheet. Although reserves were plentiful, this shift affected asset prices, particularly in riskier investments. By mid-2022, as the T-bill reduction settled down, the money flow into the PRP slowed, and bank reserves found equilibrium, providing the markets with a moment to catch their breath.
In 2023, the Boden administration was keen to implement its large-scale spending plans, leading to an increase in borrowing. To prevent any drastic changes in the yield curve, which shows interest rates across varying maturities, a significant portion of the borrowing was done through T-bills, thus maintaining stability in the bond market. As MMFs (money market funds) still had considerable funds in the PRP (Prime Reserve Fund), buying these T-bills was easy.
So, as the MMFs moved their money from the Fed PTP (Primary Treasury Dealer) to the Treasury, space was freed up on the Fed’s balance sheet, pushing bank reserves higher while still reducing its balance sheet. Despite the Fed reducing the overall balance sheet to 95bn/month, the RRP drain was happening at a faster pace. This reserve increase made it easier for the markets to rally, fueling the demand for assets despite rising prices.
It seems that the RRP is about to undergo some changes. There are less than 500 billion dollars left in the RRP, which means the Treasury cannot keep printing T-bills at the same rate as last year. To address this issue, they plan to reduce the volume of outstanding T-bills in the second quarter. However, as money continues to enter the MMFs, the funds will likely have no other option but to increase the use of the RRP. As a result, this is expected to reduce bank reserves by approximately 250 billion dollars in the second quarter.
So now what?
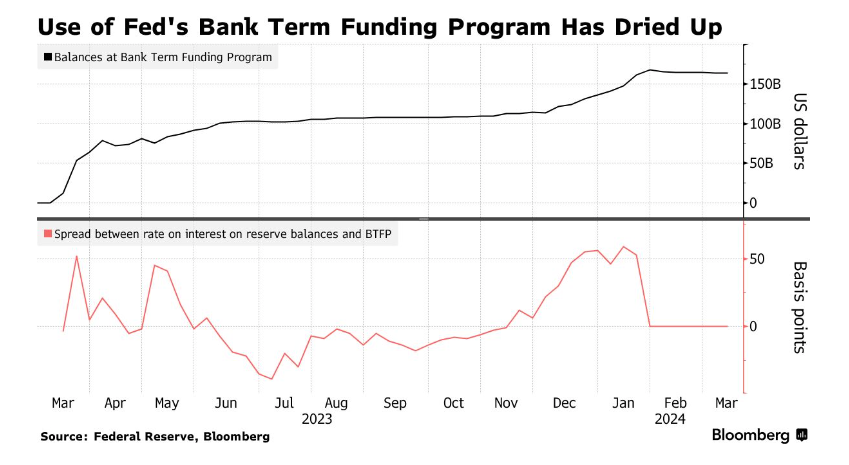
So, the Bank Term Funding Program (BTFP) has been offering cheap one-year loans from the Fed. The banks could use their bonds as collateral in full, which is a good deal if you have a bunch of those bonds. Last year, a hefty $100 billion of these loans were handed out, with $75 billion in April alone.
As these one-year loans start to expire, the money loaned (sitting in bank reserves) will shrink by exactly that amount because the program's funding is directly off the Fed's balance sheet. When you add it all up, the $250 billion being siphoned off due to more money parked in the Reverse Repo Facility by money market funds, the $100 billion from the BTFP maturing, and the Fed's ongoing trimming of its balance sheet by $95 billion a month, we are looking at a total drain over $600 billion from bank reserves in the next quarter, and the bulk of this change is hitting us as soon as April.
This isn't just a big deal number-wise; it will affect the financial markets in several ways. For starters, we can expect money market funds spread (i.e., old Libor-OIS, the difference in interest rates between different types of loans) and credit spreads (the difference between corporate bonds and treasury securities) to jump. That means borrowing could get pricier.
American banks may become less willing to lend US dollars in the foreign exchange swap market. This could result in a shift in the EURUSD fx basis, making the US dollar cheaper than the euro.
EURUSD fx basis measures cost difference between exchanging euros for dollars directly and through short-term financial instruments. This basis should be negligible but can widen due to interest rate differences and liquidity conditions.
This change came after a period of time when the dollar's value increased due to the European Central Bank affecting European bank reserves without a similar response from the RRP. However, as the upcoming reduction of US bank reserves is expected to surpass anything happening in Europe, we can expect the situation to reverse.
So, the ECB's policies have usually affected the euro's liquidity, making dollars expensive relative to euros. However, the situation is expected to reverse with a significant decrease in US bank reserves, potentially making the dollar cheaper relative to the euro as liquidity conditions tighten more in the US than in Europe.
It is important to understand the impact of changes in monetary policy and bank reserve levels on liquidity conditions and the EURUSD fx basis. It has far-reaching implications, from influencing the cost of cross-border investments and loans to determining international trade pricing.
Another twist, it is worth noting that the Treasury is changing its approach to managing debt. As they issue fewer bills, they are looking to rely more on longer-term debt (coupons). However, their refinancing plans for the third quarter in 2023 sparked controversy, as they hinted at larger auction sizes for these longer-term debts in the fourth quarter. This shift has likely contributed to some recent turbulence in the US treasury market, including a sell-off and a steepening yield curve in October. Given the current pace of financing and the Fed's reduced involvement, investors will need to purchase an additional $600 billion worth of these longer-term debts, twice last year's pace, with less cash available in the banking system to fund these trades. With less cash in the banking system for buying and financing these trades, we might see some hiccups at government bond auctions, echoing the market jitters from last fall.
Also, if you are a premium member, join Discord for full benefits.
Yes, options data, such as dark pools, options gamma, unusual flow, etc., are also included.
The article does not end here; scroll down to continue reading
When are rate cuts expected for this year (2024)?
Imagine being at a party, everyone taking ecstasy pills and having a good time. Suddenly, the volume of good music is lower. That's what happened to the European and US stock markets. The VIX saw an uptick while both bonds and the dollar rose. As a result, Asian markets followed with declines, although China's onshore market showed resistance.
The downturn aligned with U.S. economic data that didn't meet expectations. A key piece of this was the Producer Price Index (PPI), which came in at 0.4%, a bit higher than the anticipated 0.3%. The index measures the average price changes domestic producers receive for the output and indicates inflationary pressures.
While this seemed okay on the surface, a peek under the hood showed some concerns in areas like financial services and healthcare, where growth seemed to be losing steam. In addition, retail sales didn't hit what everyone hoped for.
This led analysts at Goldman Sachs to tweak their expectations for inflation, measured by the Personal Consumption Expenditures (PCE) index. They raised the volume from 2.7% to 2.9%, mainly due to higher medical service costs spotted in the PPI.
Meanwhile, in Japan, there's a lot of talk about the Bank of Japan ending its negative interest rate policy after seeing wages rise more than expected. This can lead to higher interest rates, but so far, the reaction has been more of a shoulder shrug.
This year has shown us that the relationship between stock prices and yields isn't always predictable. High yields usually make stocks less attractive, but lately, the market moves have been more about specific narratives, like company earnings reports, rather than big economic headlines. However, with fewer of these "micro" drivers, the big picture, such as macro, is getting more attention right now.
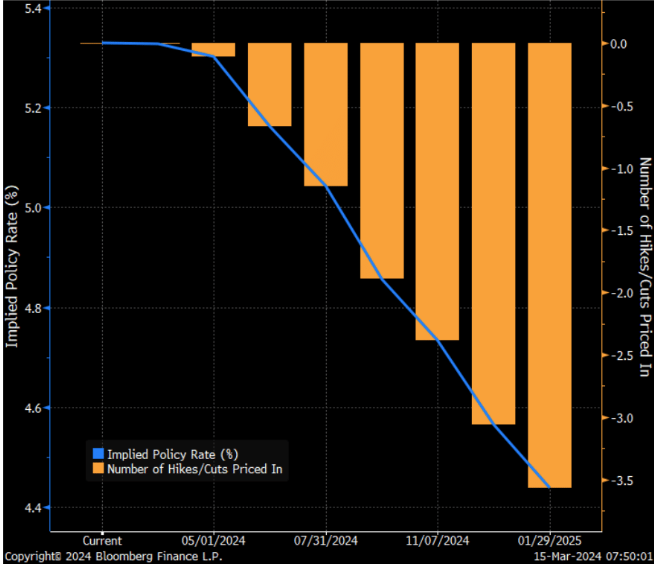
But even with all these signals flashed, the market seems more tuned into what the Federal Reserve will do next. There's a growing consensus that the Fed might start to lower interest rates from June, which is in line with evidence of slowing inflation and the Fed's predictions of a 0.75% reduction in rates.
AI phases
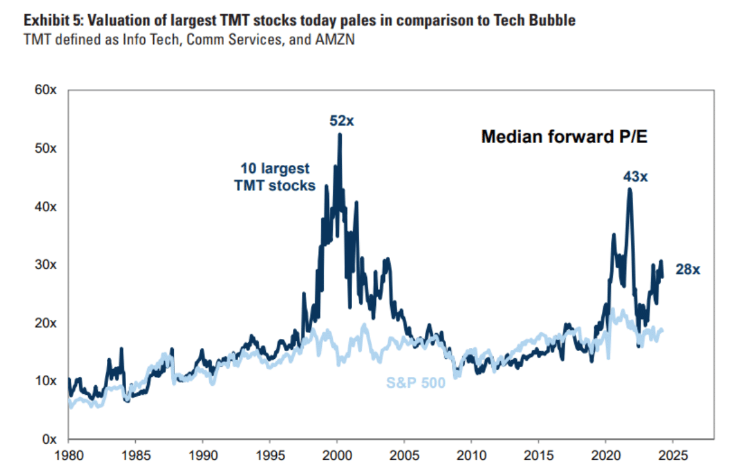
During the dot-com bubble around 2000, investors were willing to pay up to 52 times the earnings of tech companies, which marked the peak of the bubble. However, compared to today, the situation is different. The leading tech giants are currently trading at a median forward-price-to-earnings (P/E) ratio of 28 times earnings, which, while substantial, doesn't quite live up to the hype of the past.
- The dark line on the chart shows the P/E rate of the 10 largest companies in the tech, media, and telecom sectors.
- The lighter line shows the P/E ratio for the broader stock market using the SPX500 as a benchmark
- The P/E ratio helps investors evaluate a stock's valuation. A higher P/E ratio might mean the stock is overpriced, while a lower P/E ratio might signal an undervalued stock.
The 4 phases of how companies are involved in AI
- Phase 1: This phase includes companies like Nvidia that are at the forefront of AI technology, developing fundamental technologies that enable AI to function.
- Phase 2 (AI infrastructure companies): These companies provide the components and services that support AI technology. This includes semiconductor manufacturers, companies offering cloud services, and those involved in data centers and security.
- Phase 3 (AI-enabled revenue companies): Companies in this phase use AI to improve their existing product or create new products, which can lead to increased sales and revenues. These are often software and IT service companies.
- Phase 4 (AI productivity companies: This phase includes companies that apply AI to their operation to become more efficient and productive, especially in sectors that rely heavily on human labor
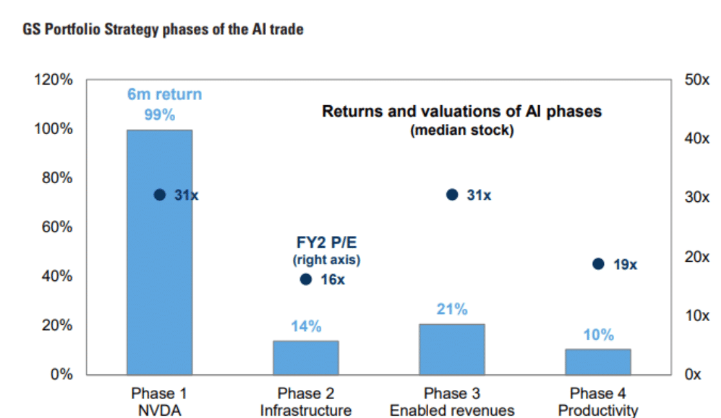
Phase 1: This bar represents companies at the forefront of AI, such as Nvidia. The bar shows a 6-month return of 99%. The dot at the top of the bar shows the forward price-to-earnings (FY2 PE) of 31x, which indicates that investors expect more future earnings.
Phase 2, these stocks have a lower 6-month return of 14%. The FY2 P/E ratio for these companies is 16x, which is lower than phase 1, indicating more moderate growth expectations. Remember, they're expectations.
Phase 3 shows a 21% return over 6 months and an FY2 P/E ratio of 21 times, which is higher than Phase 2 but still lower than Phase 1.
Phase 4, the 6-month return here, is over 10%, with the lowest FY2 P/E ratio of 19 times, showing more conservative growth.
Companies directly involved in the development of AI technology are enjoying the highest return and valuation, while those applying AI to enhance productivity are experiencing more modest growth. The current market trend is to reward innovation and direct involvement in AI more than the application of AI to existing business models.h
Gold ETFs don't flow into Bitcoin ETFs
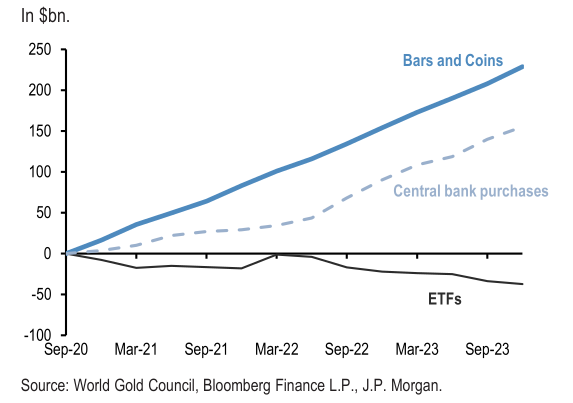
Up until now, Bitcoin funds have received a massive influx of $10.6 billion, while physical gold ETFs have experienced a significant outflow of $7.6 billion. This trend is visible on the chart, where the line representing Bitcoin funds ascends steeply, indicating rapid and steady growth. On the other hand, the line representing gold ETFs is descending, which means that investors are withdrawing more money than they are investing.
It would not be entirely accurate to say that investors are abandoning gold in favor of Bitcoin. There are several factors at play here. Notably, the launch of new Bitcoin ETFs, particularly those dealing with actual Bitcoin (spot Bitcoin ETFs), has made it easier for investors to invest in Bitcoin. Many investors are attracted to Bitcoin due to its novelty factor and potential for higher returns, which has led to a surge in inflows to Bitcoin funds.
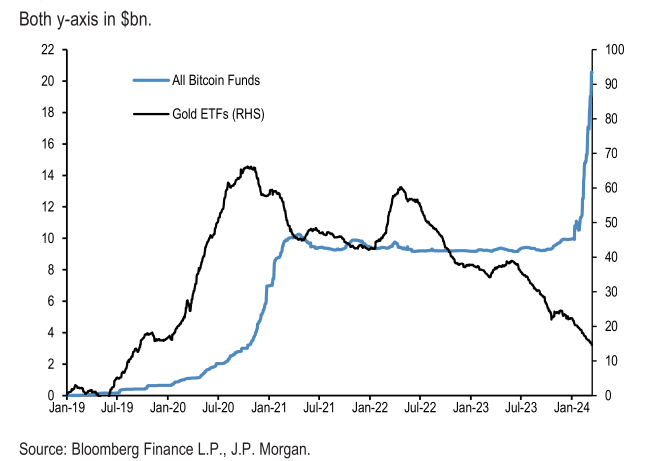
Gold is not a new asset, but its current outflow may be due to a lack of investor interest or better performance of other assets, such as stocks and Bitcoin. (Okay, so maybe a bit more accurate LOL)
But the decline in investment in physical gold isn't just a flash in the pan; it's a trend that's been in motion for the last couple of years, not especially just because there's a bitcoin ETF now.
Since the COVID pandemic, there has been a growing emphasis on privacy and a desire to own something tangible, which gold bars do fulfill.
ETF holdings are public records, and each transaction can be traced. In contrast, gold bars and coins offer a level of anonymity and privacy that ETFs can't match. In worst-case scenarios where the financial system may be at risk, owning physical gold may be seen as a safer choice. In such situations, holding a paper ETF may not be helpful if you cannot access the underlying asset due to counterparty risks.
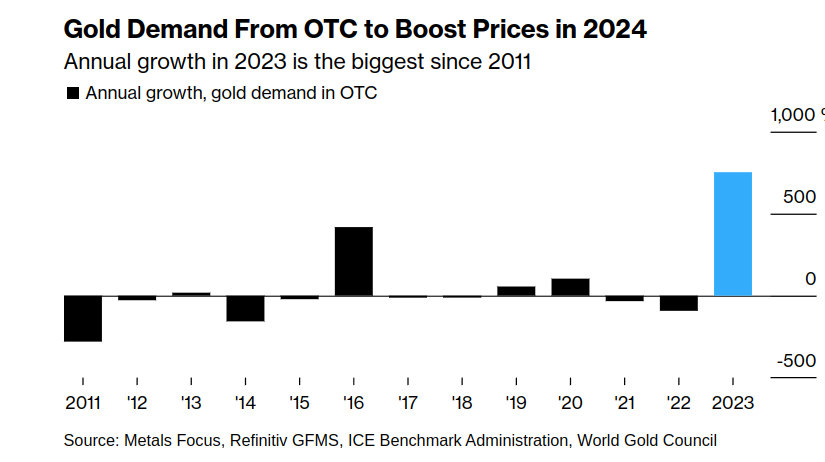
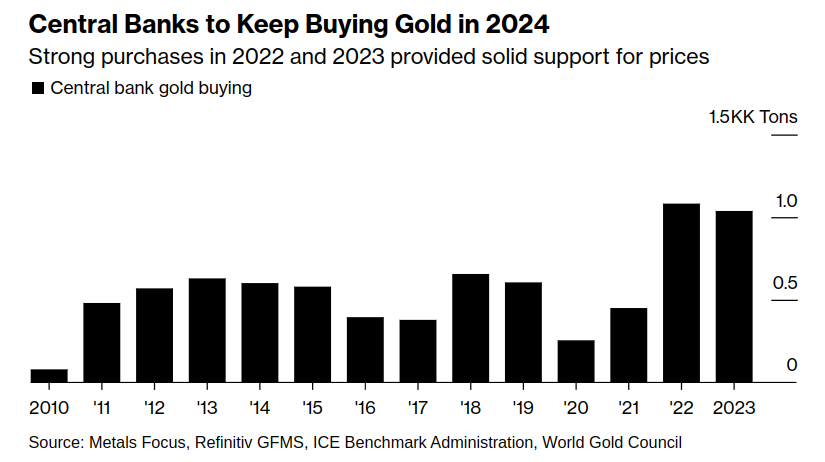
While gold ETFs have been declining, the buying of gold in the form of bars and coins has been on a ready rise since the third quarter of 2020. These purchases have reached a cumulative $230 billion, as analysts at JPMorgan pointed out multiple times.
The outflow from gold ETFs doesn't signal a loss of faith in gold as an investment. The speculation of flows rotating from gold to bitcoin is not true, but it is understandably used by people who don't know any better because, on the surface, it does look like it. Again, it's not true. Yes, many propagandists know this, but they still push this narrative.
So instead, it indicates a strategic shift by private investors towards a form of gold ownership that aligns with their need for privacy and physical possession. This trend actually shows the perspective on gold's role as a resilient asset in an investor's portfolio in times of uncertainty.
The net selling of gold ETFs does not reflect a decrease in private investors and individuals' overall demand for gold.
Bitcoin Inflows
There has been much discussion surrounding the billions of dollars flowing into the recently launched spot Bitcoin ETFs. However, it is important to note that this does not necessarily indicate that new capital is entering the Bitcoin market. It can be argued that a significant portion of this influx is simply a transfer of bitcoins held in wallets on exchanges or with retail brokers to these new ETFs.
So, It could very well be that investors are moving their existing bitcoin investments into ETFs to benefit from the conveniences and regulatory protections that ETFs offer, such as mainstream access and ease of investment for those who weren't technical and confident enough to be their own bank. Crypto exchanges have seen Bitcoin outflows.
JPMorgan analysts on Bitcoin
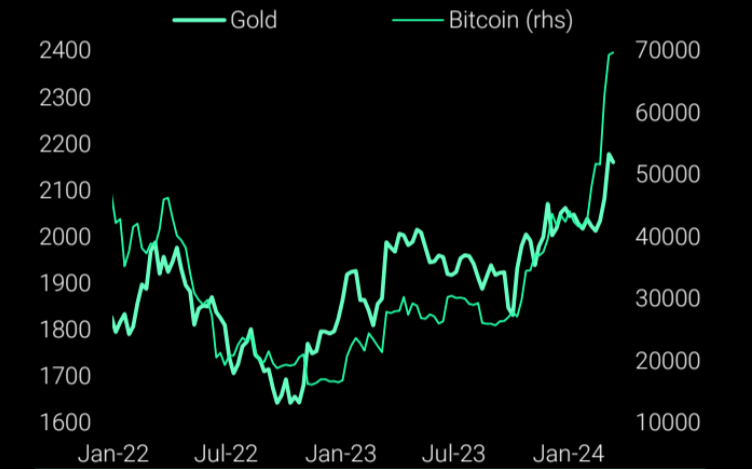
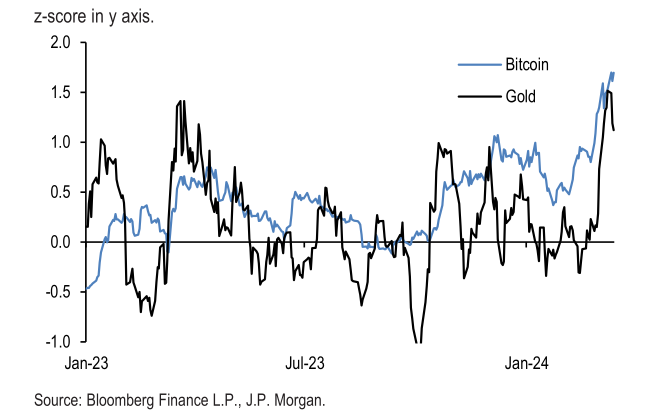
Speculative institutional investors include hedge funds and momentum traders like Commodity Trading Advisors (CTAs); they make investments based on the direction and pace of price movements. According to JPM, they've been participating in the markets for both gold and Bitcoin, contributing to the recent price appreciation. They know this means they can look at future contracts.
Since February, there's been a notable accumulation in positions in Bitcoin futures, estimated to be at $7 billion, and even more so in gold futures with a massive $30 billion build-up.
Momentum trading strategies like those used by CTAs tend to amplify price movements in both ways. Traders often jump on the bandwagon when prices move strongly in one direction.
The momentum signals for both gold and bitcoin are reaching 1.5 standard deviations, which means that the current investment trend is stronger than usual. While this is good, it also increases the risk of mean reversion. Basically, expecting prices to move back to their long-term average. When momentum signals are exceptionally high, it often (not always) can be a sign that a reversal is around the corner.
Also, between February 26th and March 10th, MicroStrategy bought up more than $800 million worth of BTC, which was funded by selling convertible notes. Convertible notes are a type of debt that investors can later convert into stocks. This is not a one-off for Microstrategy, it's part of an ongoing strategy, and they're not stopping here.
MicroStrategy is essentially taking a gamble on Bitcoin by borrowing money to purchase it, hoping. Still, ,the profits they make from Bitcoin's rise in value will exceed the interest they have to pay on the borrowed funds. If Bitcoin's price goes up, MicroStrategy could make a significant profit, but if Bitcoin's price falls, it could spell trouble for them, particularly because they are using debt to finance these investments.
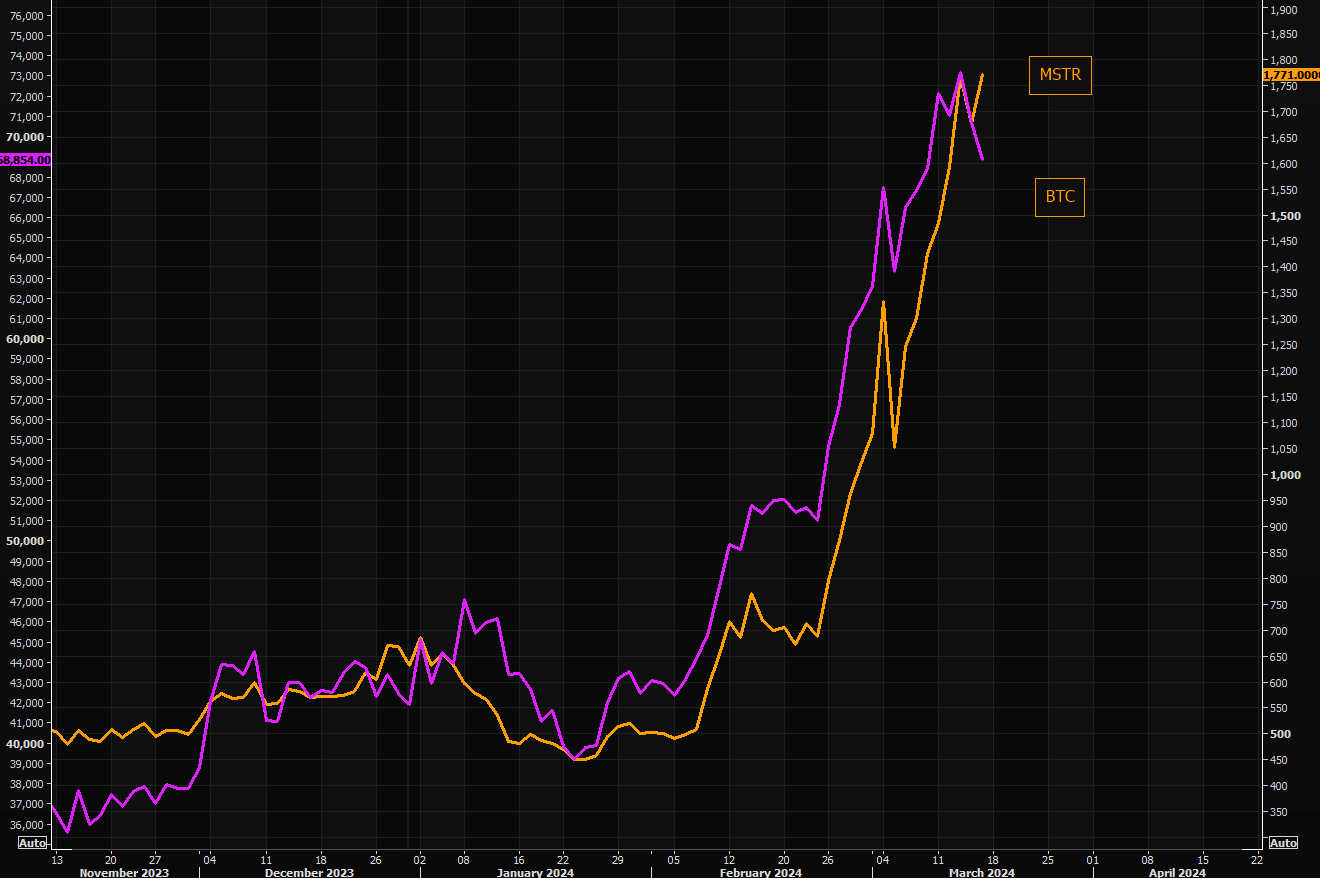
This strategy magnifies gains during rallies but also introduces risk. If there's a downturn in the market, MicroStrategy may experience deleveraging. They have to sell assets at a loss to pay back the debt they took on to buy Bitcoin.
While I have to say their strategy has been ironically working out for them, there's always a risk. How big? Depends on who you ask. A Bitcoin maxi who has invested his life savings into Bitcoin will claim it will never go back down below $50k.
On CryptoTwitter, there's no good answer. If Bitcoin goes up, anyone who expresses doubts will be clowned on. If Bitcoin does go down, they'll all laugh at Saylor.
Fed Balance sheet and BTC divergence
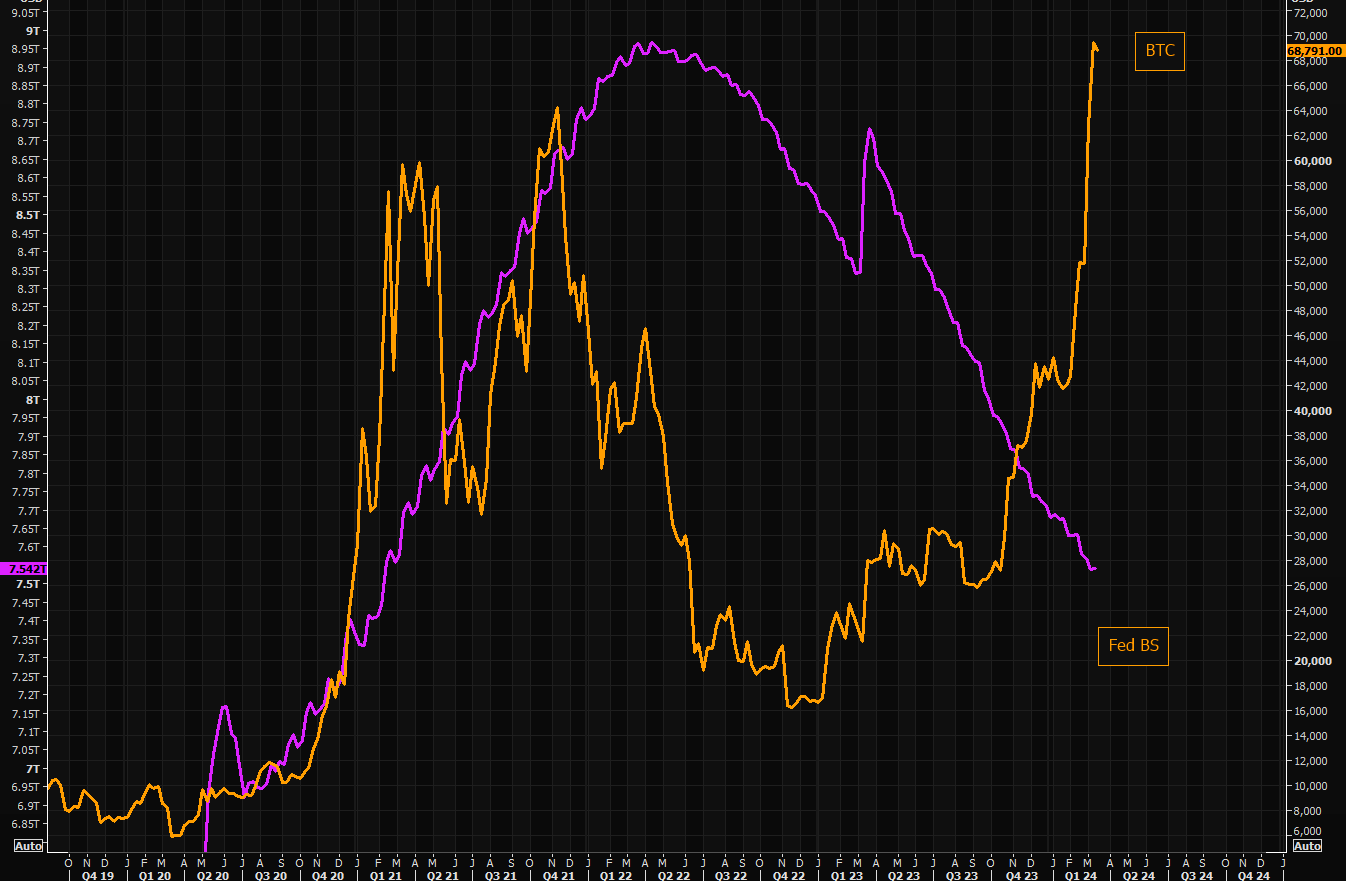
There has been a recent divergence between the correlation of Bitcoin price and the Federal Reserve's balance sheet. Although in the past, changes to the Fed's balance sheet have influenced Bitcoin price movements, this is no longer the case. The gap between the two seems to be widening.
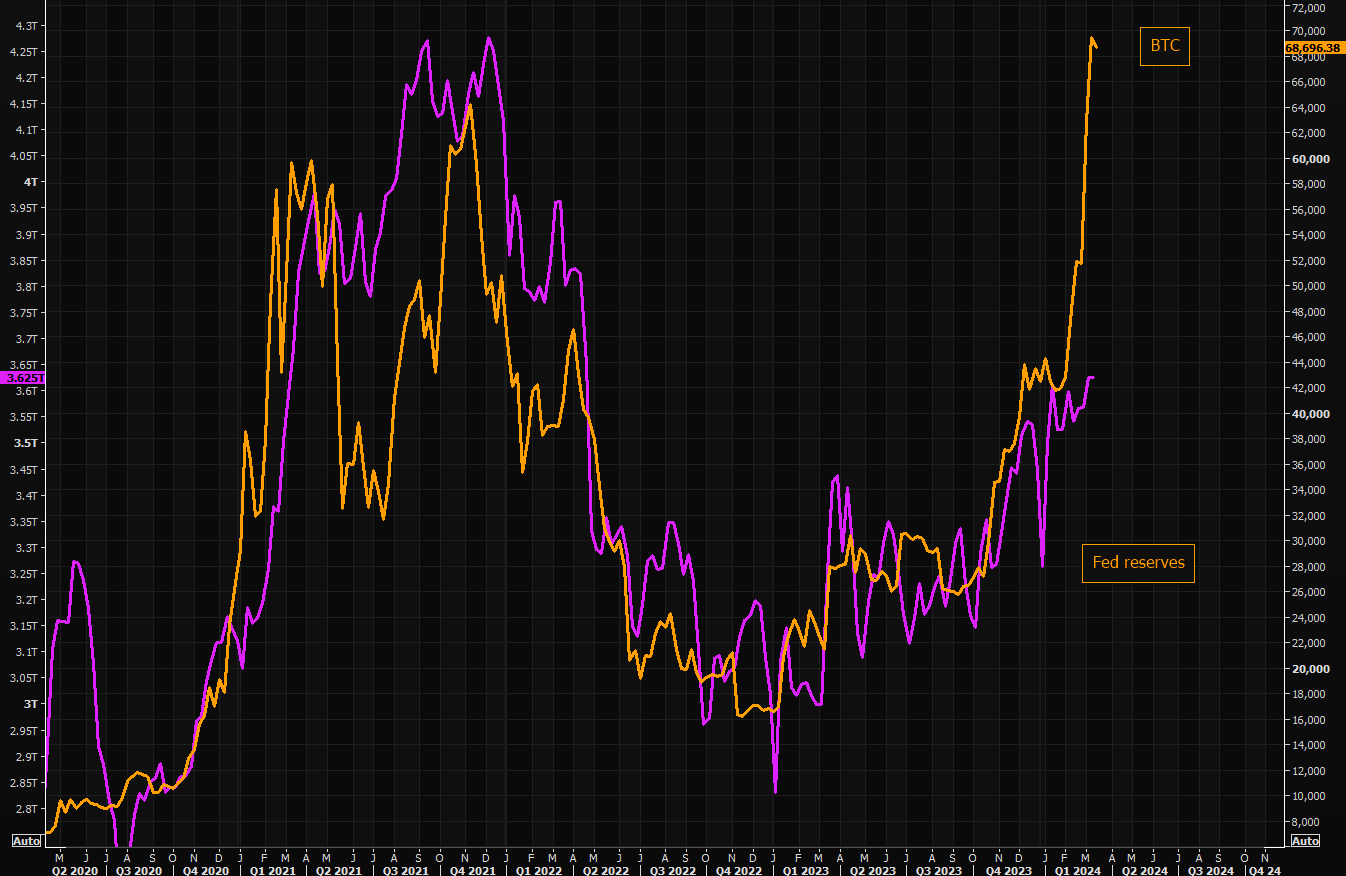
Fed reserves and Bitcoin
The Federal Reserve's reserves and the price of Bitcoin were moving in tandem until the ETF launched. The ETF had an impact on the market as it opened up investments in Bitcoin to a broader range of investors.
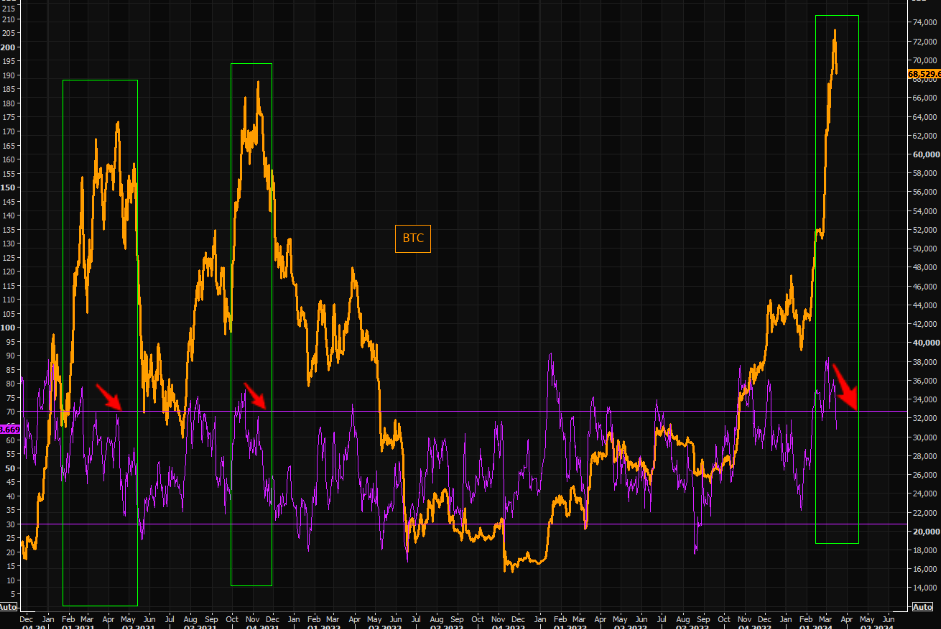
BTC RSI Negative divergence
In the chart we can see RSI) is plotted below the price chart of Bitcoin (BTC). Although the price of BTC has been increasing, the RSI is trending downward. This divergence between the two is often a signal that the bullish momentum is starting to fade, and a temporary pullback can follow. It is worth watching this trend closely.
Become a Premium member. Premium newsletters & Discord community access
Join Discord to get the full value out of the newsletter. There's no extra cost associated with Discord. Yes, options data, such as dark pools, options gamma, unusual flow, etc., are also included. Also, educational content, reports, and direct questions to me, and often, I share my trades & thoughts in real-time as the market moves.
However, I want you to understand rather than copy a trade.

Become a premium member. Besides crypto, if you cashed out a lot or are planning. I highly recommend the "stocks" and "fixed-income" channel sections for long-term plays and wealth-building