2024 contrarian trade: Forget Gamma; V for Long Vega

Over the past two years, traders have had numerous opportunities to make profitable trades. In 2022, many traders made significant profits by short-selling tech stocks, which was unexpected in 2021. However, in 2023, the market took a complete 180-degree turn, reversing course to the upside, causing bearish traders who had been waiting for so long since COVID-19 to be run over again.
2023, and big tech was back in fashion. Even retail traders put their chips on AI stocks and big tech such as Apple, Google, Microsoft, Meta, Nvidia, Tesla, & Amazon (also known as the Magnificent 7).
Some traders even hit the jackpot with small-cap stocks, buying the bottom and making fortunes. The SPX500 and Nasdaq had 9 consecutive green weekly candles. That's a record, the largest winning streak in 20 years.
Now, let's talk about our favorite people. Derivatives traders and hedge funds. These guys usually deal with futures and options, a whole different game.
2022 was a tough year for traders due to a negative gamma environment that led to violent short-squeezes. Dealers were forced to buy as prices bounced, which amplified moves in both directions. Hedging portfolios became challenging as the VIX didn't make significant moves. This could be due to the rise in popularity of 0-DTE options, which are not included in the VIX. Notably, 0-DTE options could have contributed to the lack of volatility in the VIX. The VIX does not include 0-DTE options.
2023 didn't exactly roll out the "red carpet" either. Derivatives traders typically enjoy volatility in the market, but there wasn't much of that in the recent weeks, except for a few minor disruptions caused by banking issues in the U.S. and a conflict between Israel and Palestine. However, the market quickly stabilized and risk gradually receded after the initial few weeks.
Slow burn hedge
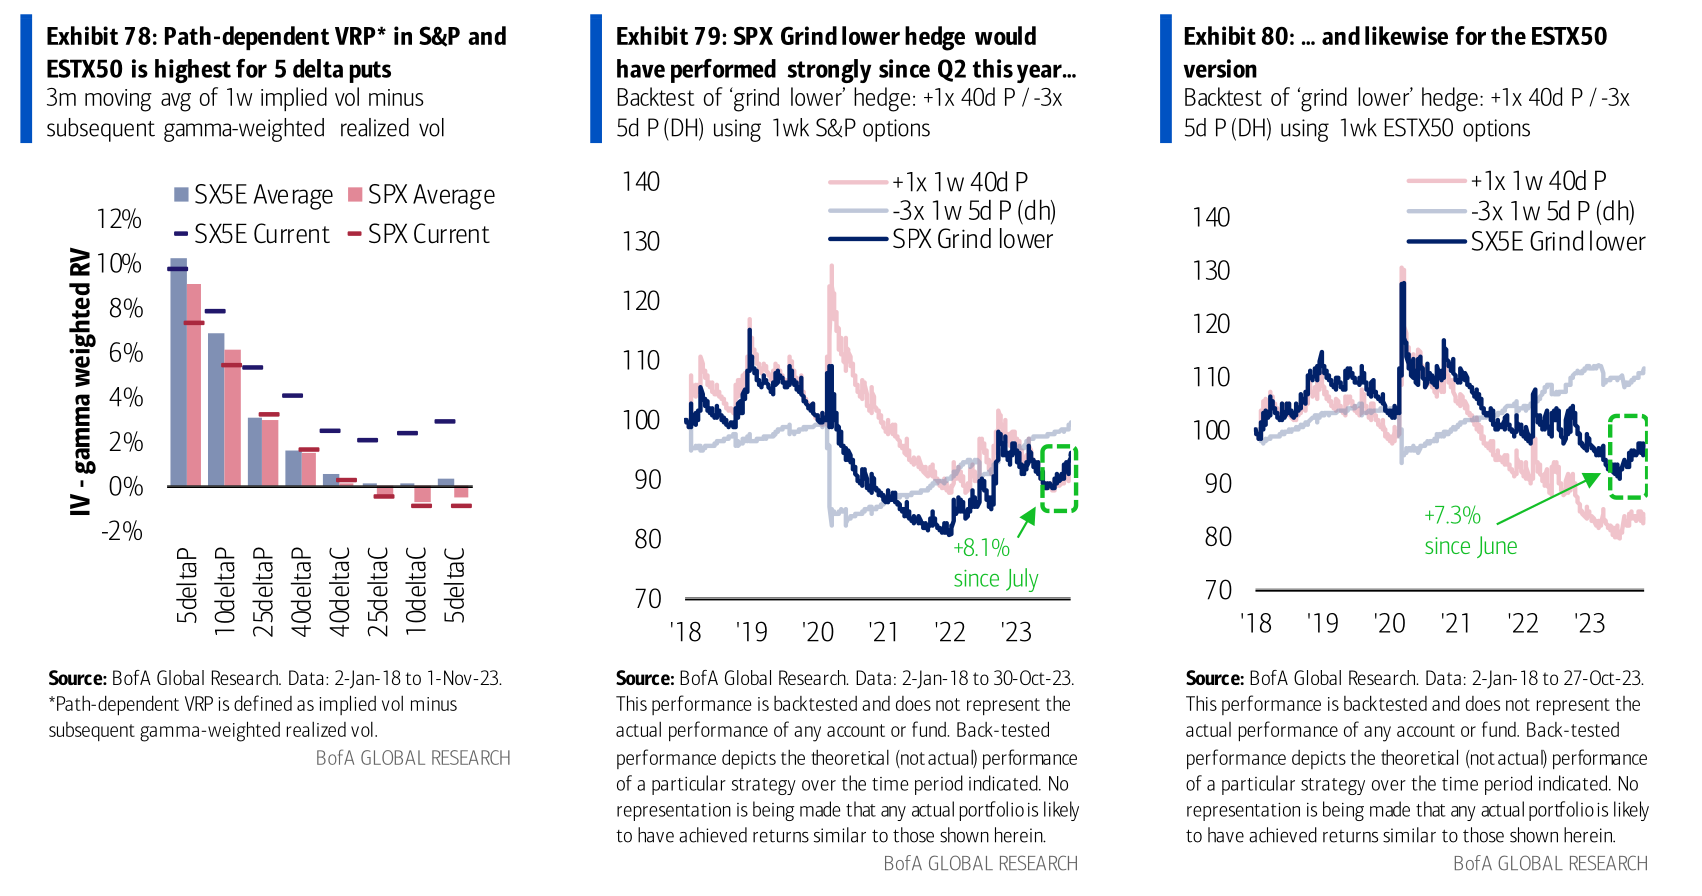
You're playing defense in the stock market game. One is buying weekly put options that expire in 40 days, protecting you from aggressive sell-offs. The second strategy is more like a strategic counter-attack, selling put options that are just 5-days away from expiration.
Now, here's where it gets interesting. While the market didn't plunge into chaos (which is usually when those "the big short" hedges shine), this is more of a "Slow burn" hedge strategy.
This strategy thrives when the market takes a leisurely stroll downwards rather than a nose drive. Actually, this strategy managed to get an 8.1% uptick since July.
That's pretty interesting and impressive in an environment where true panic-selling, a black swan, and left-tail events were more of a "no show," and now investors are even more skeptical about a major sell-off.
Keep in mind that this is all based on a backtest. It's all hindsight, but it is still interesting.
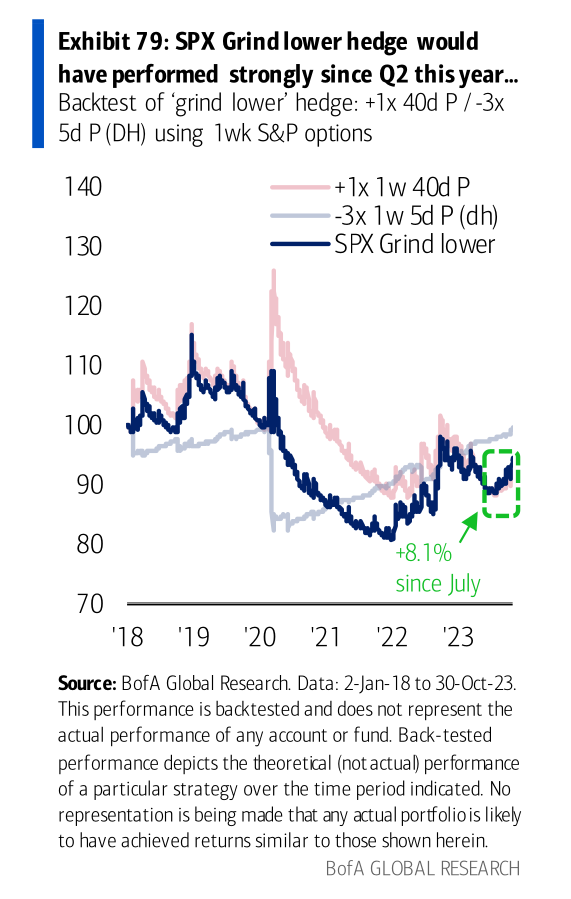
+1x 1w 40d P: This line represents the performance of buying weekly put options with 40 days to expiration, a defensive strategy used to protect against market downturns.
-3x 1w 5d P (dh): A more aggressive hedging strategy involving selling put options that are five days from expiration, possibly in a three-to-one ratio compared to the number of options bought in the first strategy.
SPX Grind lower: This line represents the underlying strategy that the document refers to as the 'grind lower' hedge. It does seem to have been designed to perform well in a market that slowly decreases in value rather than crashing suddenly.
When everyone bought the dip, strategies were still available to protect against a slow downside.
Muted volatility
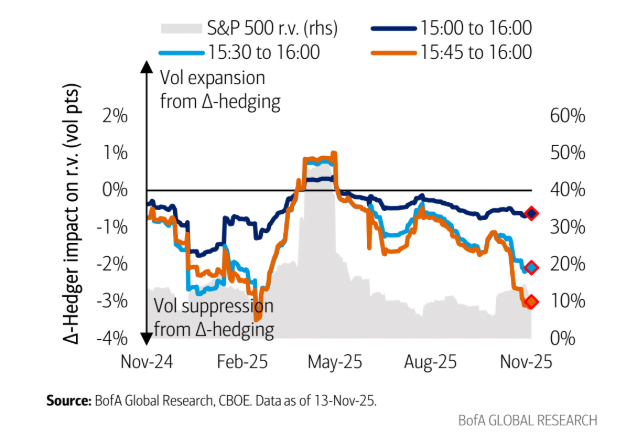
Remember 2022, when we were stuck in trenches fighting for our lives? Equity markets were stuck in a slow bleed and surprisingly, 2023 didn't give us volatility either. It was more stabilized.
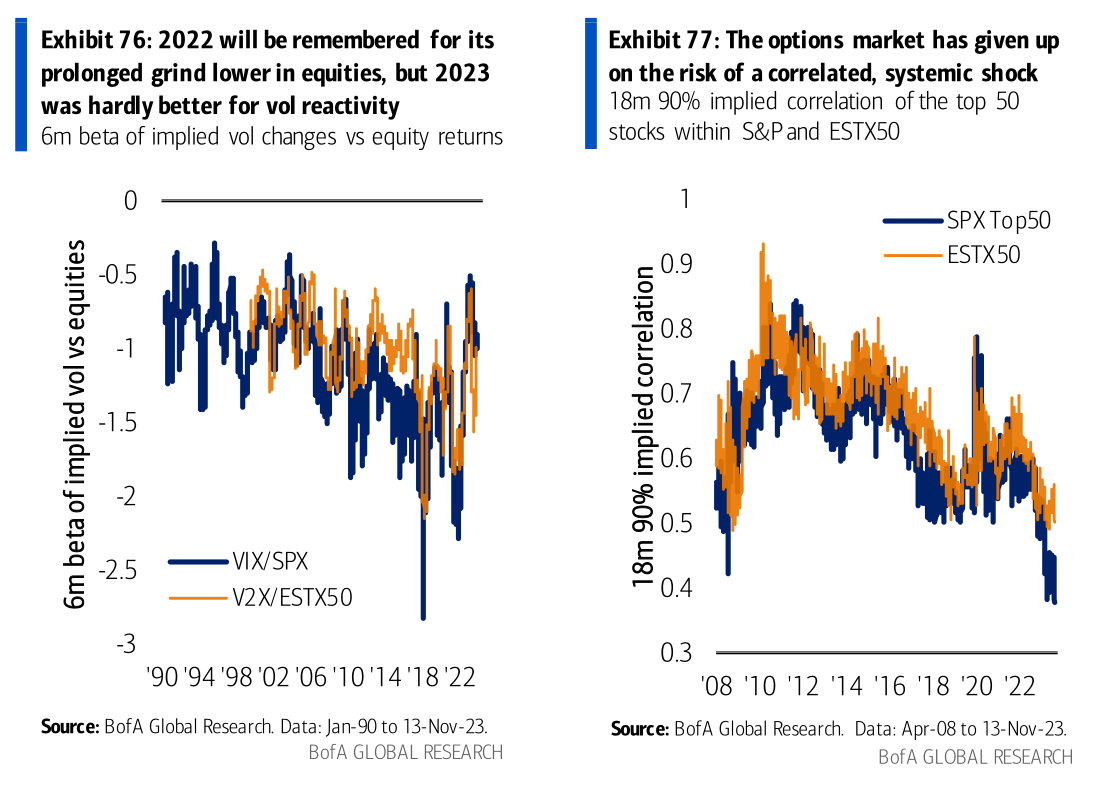
Even during the tense moments of regional banks and geopolitical tension in the Middle East, the expected volatility spikes were more like blips. Exhibit 76 shows that market volatility was oddly muted.
Let's move on to Exhibit 77, where we can observe a market that is not too concerned about a potential correlation. By closely monitoring the top 50 stocks, the options market shows less apprehension about a pullback, indicating that investors are more concerned about missing out on the party than experiencing a market downturn or any systemic risk.
So, it's worth to ask.
When will this calm start to crack?
It is difficult to predict the stock market. At present, only a small number of traders rush to buy volatility when the market drops. They are hesitant to go against the optimistic "buy the dip" crowd and the general consensus that selling options is a good idea. Additionally, some perceive that the Fed Put is back.
Although the markets have not experienced significant declines recently, it is important that we remain vigilant. It appears that many people have dropped their guard down. We should be aware of potential risks, such as the Federal Reserve remaining on hold until there is a significant market disruption, the possibility of a recession, or the potential for the AI bubble to burst.
Bank of America crunched some numbers and has a hedging strategy that has been racking gains. Their 'grind lower' strategy is for every 3 short-term puts you sell on one side, you buy a longer-term put that could pay off if the market takes a dive. As mentioned before.
Since summer, you'd be sitting with over 7% gain, and it's all about balancing your bets and some options to weather any storm. So before you write off hedging as "yesterday's game," it's worth considering starting hedging.
When it comes to hedging, it's not only about preparing for the worst; it's also about playing the slow market declines that don't have enough magnitude to make a naked put worth buying as a hedge.
There's an unusual type of hedging strategy called non-convex hedges. Unlike conventional hedges, these hedges don't follow typical patterns where gains accelerate with market movements. Instead, they focus on selling volatility or skew to create a steady and more predictable form of protection that's based on market direction, not volatility. Therefore, the strategy is to sell vol/skew to fund reliable delta-based protection.
Sell 3 times the amount of delta-hedged 1-week, 5-day puts daily, using 1/5 of the notional each day, to fund a longer position on SPX500 and Euro Stoxx 50 1-week, 40-day puts.
Have a look at this setup. It's designed to capitalize on the high volatility risk premium, particularly on the 5-day puts. Basically, the market tends to overestimate the risk associated with these short-term options. This can be exploited by "savvy" traders who can use this to their advantage for VRP (volatility risk premium) harvesting.
The V-trade
The V-trade is a clever hedging tactic. On one end, you're selling options that are a bit OTM, providing you some cash to pay for the other hedge. So, on the other end, you're buying options that are way OTM.
The V trade breakdown:
- Selling 6-month, 25-delta puts, which are slightly OTM. These become profitable if the market drops a little, but not with magnitude. This will help you offset the hedge you're about to place
- Buying 3 times as many 18-month, 5-delta puts, which are deeply OTM and have a significant vega profile. Vega measures an option's price sensitivity to changes in the underlying volatility.
Both actions are delta-hedging, meaning the strategy aims to neutralize small moves, focusing instead on benefiting from large ones. The strategy is structured to set up monthly with 1/6 of the national value and held for 6 months.
Exhibits 81 and 82 show potential returns of the V-trade strategy for the S&P 500 and Euro Stoxx 50, respectively, against their maintenance cost. The S&P version shows a 5.5% return with a 12 basis points cost of carry per annum, while the Euro Stoxx 50 version shows a 4.7% return with a 32 basis points cost of carry per annum.
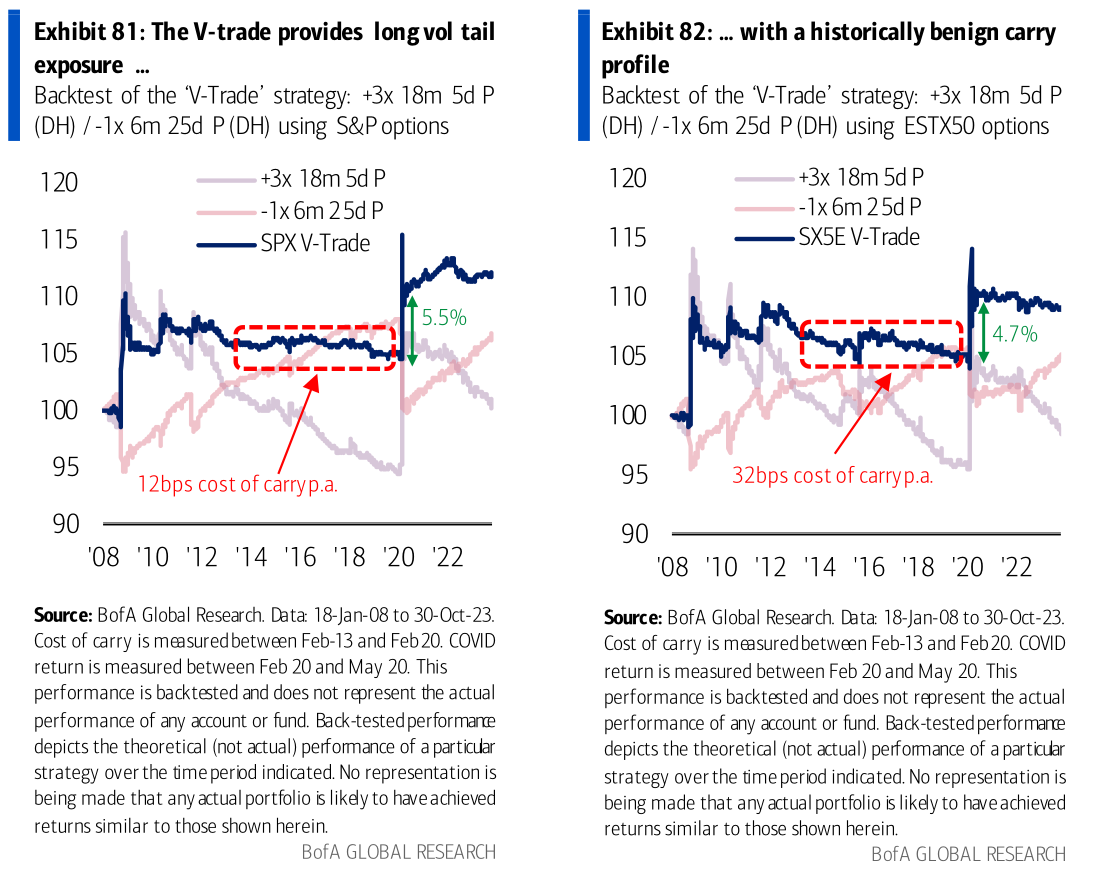
The effectiveness of a strategy during financial market shocks, such as COVID-19 and the Global Financial Crisis. The strategy had a 50x payout ratio compared to its cost in the 7 years before COVID-19 and performed well during other shocks in 2010 and 2011.
The V-trade and its Vega P&L
The V-trade has a significant long vega profile, which can potentially generate a considerable profit and loss from increases in implied volatility after a hypothetical shock.
- Beta-scaled vol bump/compression: Assume a 5% increase or decrease in volatility. The effect on different option tenors is adjusted according to teach tenor's historical beta to the 12-month volatility. Beta here reflects how much an option's implied volatility is expected to move relative to a move in long-term (12-month) volatility.
- Parallel shift up: Implied volatility across all tenors increases by 5%. This scenario represents a uniform rise in volatility levels, irrespective of the option's expiration date.
- Long-dated vol bumps more than short-dated vol: low volatilityLonger-term options (13-18 months remaining) experience a 6% increase in implied volatility, while shorter-term options (1-6 months remaining) see a 5% increase during a macroeconomic change. This indicates higher demand for longer-dated index volatility due to the unwinding of popular trades that bet on low-volatility.
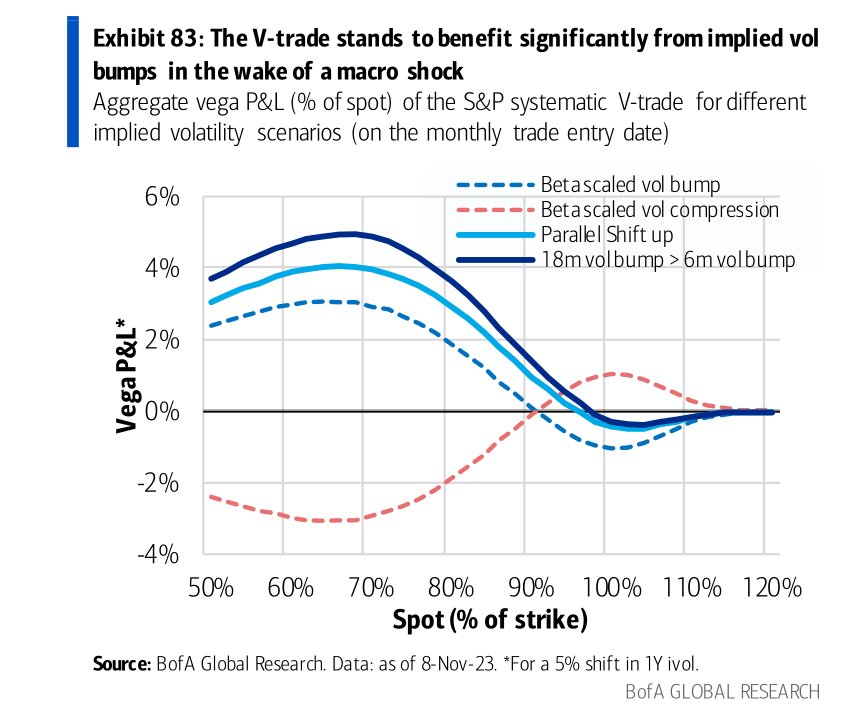
The V-trade strategy performs best in scenario 3, where long-dated volatility increases more than short-dated. It is well-suited to profit from steepening implied volatility curves, indicating higher long-term uncertainty in the market.
V-trade offers impressive returns during market turbulence, such as the May 2010 volatility vortex. This suggests that it can turn market fluctuations into profitable opportunities for investors. Unexpected market shocks could be an ideal chance for current investors to maximize returns.
IF YOU MADE IT THIS FAR, YOU ARE PROBABLY A CERTIFIED AUTIST. THE ARTICLE DOES NOT END HERE
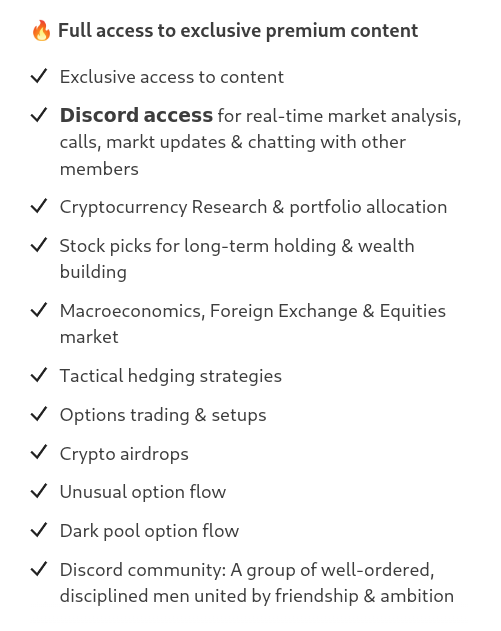
Become a Premium member. Premium newsletters & Discord community access
ALSO, THE ARTICLE DOES NOT END HERE
Join Discord to get the full value out of the newsletter. There's no extra cost associated with Discord. Yes, options data, such as dark pools, options gamma, unusual flow, etc., are also included. Also, educational content, reports, and direct questions to me, and often, I share my trades & thoughts in real-time as the market moves.
However, I want you to understand rather than copy a trade.

Become a premium member. Besides crypto, if you cashed out a lot or are planning. I highly recommend the "stocks" and "fixed-income" channel sections for long-term plays and wealth-building
Diversified hedging portfolio
Staying flexible and diversified is the name of the game, especially when it comes to hedging. While the market favors 'slow grind lower' hedges, it's also worth looking at the low implied correlation. A chance to cheaply hedge against shock waves
By merging 'Grind lower' hedges with the 'V-trade' for the SPX500, we can craft a diversified hedging portfolio prepared for this environment.
To enhance the portfolio's effectiveness, a cVaR minimization algorithm is used to optimize strategy weights. The goal is to keep the portfolio's tracking error within 5% of the S&P 500's performance. Optimization is based on data up to the start of 2022, with out-of-sample testing to ensure robustness.
The weights of the strategies in a portfolio are determined by an algorithm called Conditional Value at Risk (cVaR) minimization. This algorithm is designed to minimize the portfolio's expected loss or risk beyond a certain level in the distribution of potential losses while ensuring a 5% tracking error relative to the S&P 500. Tracking error refers to the difference between the price behavior of a position or portfolio and the price behavior of a benchmark.
Exhibit 84 displays a diversified S&P hedge portfolio that combines the 'Grind lower' strategy with the 'V-trade'. The optimized blend, utilizing a Conditional Value at Risk (cVaR) minimization algorithm, has outperformed the individual strategies during backtesting. This portfolio could offer strong protection while minimizing risk.
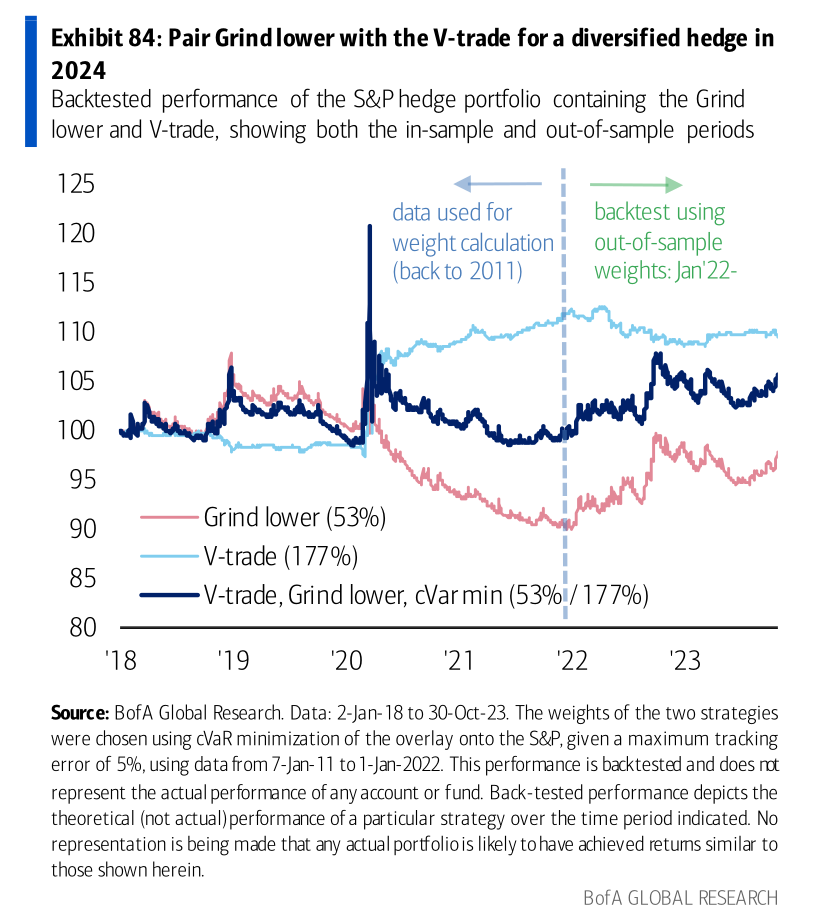
Exhibit 85 compares the S&P 500 index with the diversified hedging portfolio's performance overlay. The orange line represents the hedging strategy, while the blue line represents the S&P index with the overlay. The diversified hedging portfolio improved the overall performance of the S&P index, especially after adjusting the strategy weights (indicated by the vertical dashed line, so I assume).
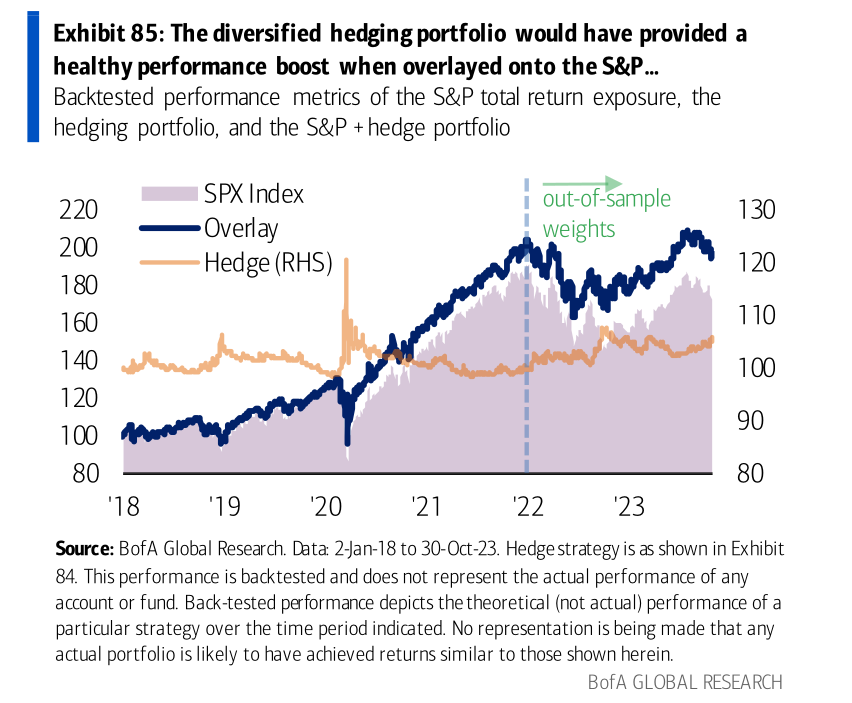
Exhibit 86 compares the S&P index with the hedging strategy and the overlay using different performance metrics. Despite a 5% tracking error constraint, the overlay strategy showed a significant risk reduction and a higher Sharpe Ratio. This indicates an improved risk-adjusted return of the portfolio.
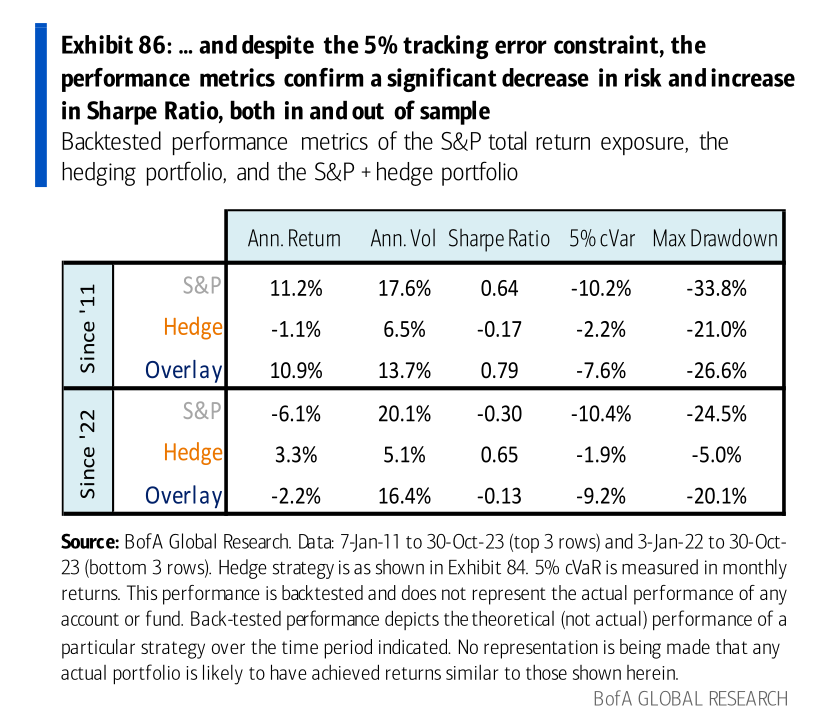
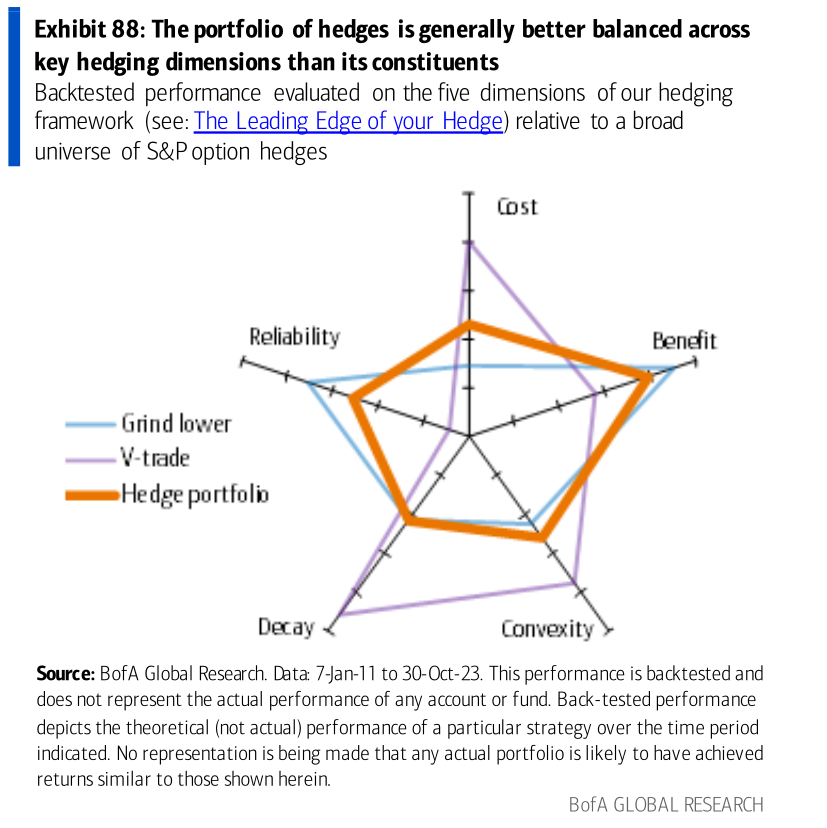
Exhibit 88 A radar chart is a graphical method of displaying multivariate data in the form of a chart with quantitative variables represented on axes starting from the same point.
Grind Lower Strategy: The strategy has mixed performance, with lower scores on 'Benefit' and 'Convexity'. A more consistent return but doesn't benefit much from sudden market movements.
V-Trade Strategy: V-trade strategy scores high in Convexity and Benefit, indicating good performance in profiting from large volatility movements. However, it might be expensive, as shown by its position on the Cost axis.
Hedge Portfolio: The combined strategy of Grind Lower and V-Trade strategies results in a well-balanced hedge portfolio. It balances cost-efficiency, reliability, and potential for high returns during volatile market conditions.
So by blending the 'grind lower' and 'v-trade,' we get a 'Hedge portfolio,' the goldilocks of hedging strategies. It doesn't go overboard on the cost, offers a reliable safety net, doesn't waste away with time, and still makes the most out of those big market moves.
ApeX DEX
ByBit has made KYC mandatory as many other exchanges. Why not try out ApeX DEX? You can use your wallet or social account to use the DeX. No gas fees are required for trading & the fast trading experience is like a CEX.
You don't even need metamask. Using social logins like Facebook, Discord, Gmail is an alternative option. That way, you can access ApeX anywhere.
Consider ApeX DEX
By the way, ApeX added a lot more altcoin futures such as Celestia $TIA
For a lifetime fee discount, check the link: https://pro.apex.exchange/trade/BTC-USDC/register?affiliate_id=46&group_id=83
IOS & Android app is available for ApeX DEX too
Ref code: 46
Social logins is optional to trade anywhere without the need to be at your desk etc.