Tactical Hedging

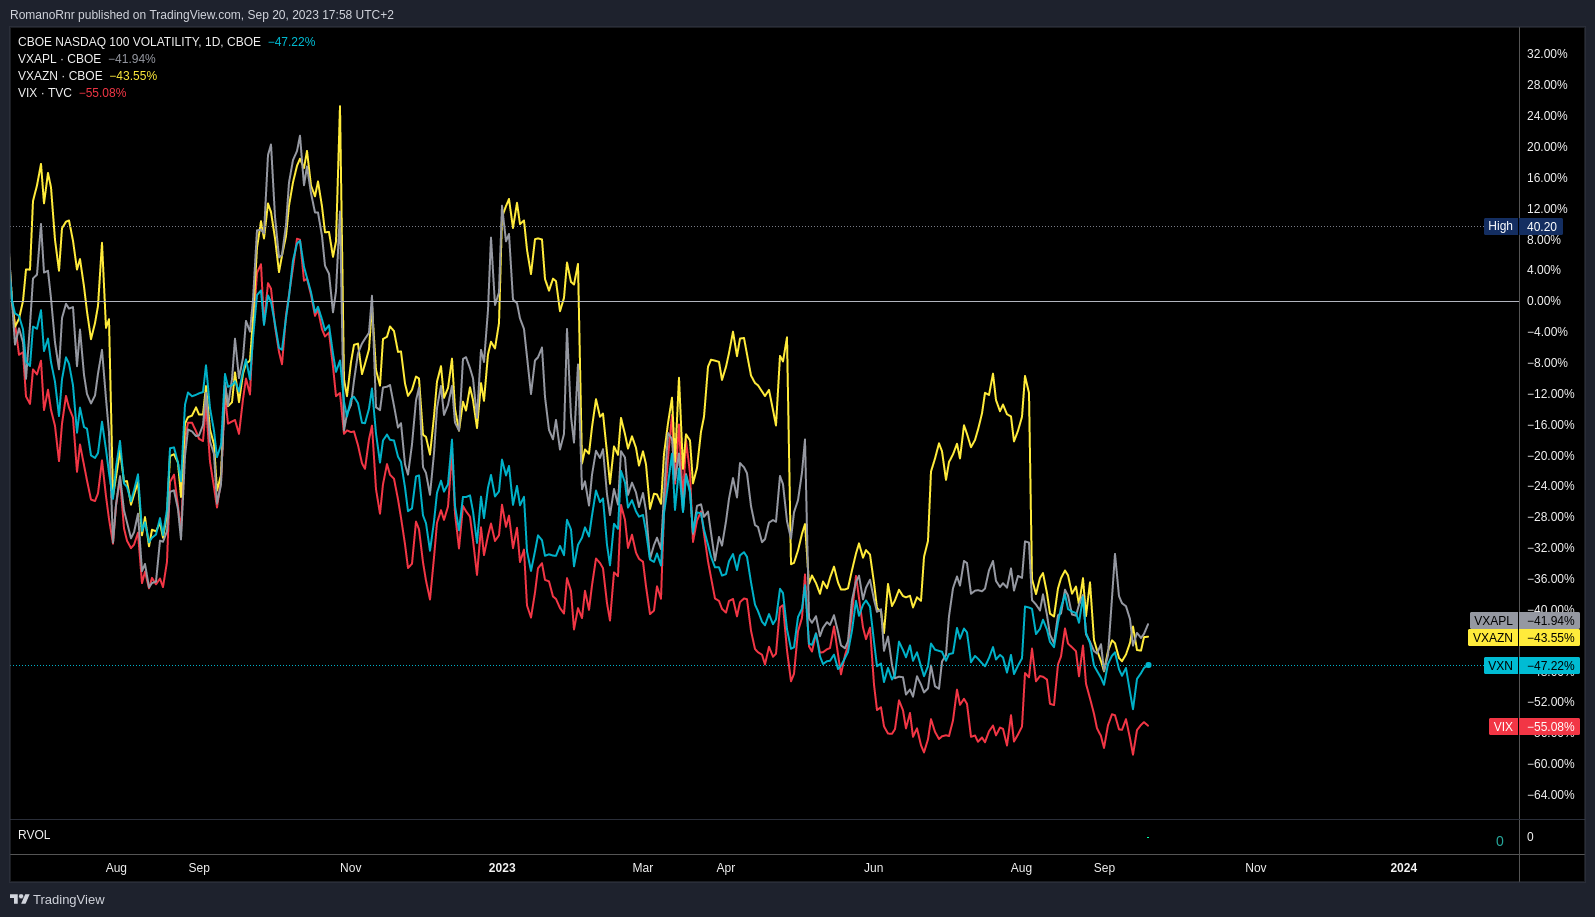
The VIX has been trending down since the start of 2023, dropping by more than 40% from 22.75 on January 3 to 12.68 on September 14, at the time of writing this. That's mainly due to encouraging economic news from the U.S. and increasing optimism about artificial intelligence. As a result, investors have been willing to take on risk and buy stocks, driving up their prices and lowering their implied volatility.
It's worth mentioning that the rise in the SPX500 & Nasdaq has been mainly driven by the magnificent 7 (Tesla, Google, Microsoft, Apple, Meta, Amazon & Nvidia). Eli Lilly has been making a strong run, but I digress.
This sense of safety and illusion has led to a new trend of being "short volatility" with short-vol ETFs, put-selling to fund 0-DTE call options, etc. That has all been leading to more volatility compression. The retail army has been strong. This low volatility made it cheap to buy call options, fueling the market up more, etc.
Disclaimer: This is all written before September 20, 2023 (FOMC). It was too much work get it done within one day. Writing initially began at September 14
However, the VIX is too low and doesn't fully capture the underlying economic risks., which are many. They all could easily trigger a spike in volatility.
- Uncertainty over the debt ceiling and the fiscal policy of the U.S. government, which could result in a government shutdown or default on its obligations
- Tapering of the Federal Reserve's bond-buying program could lead to higher interest rates and lower liquidity in the financial markets.
- New variants of COVID-19 could pose new lockdowns. After all, the elections are starting soon.
- Geopolitical tension between major powers such as China could escalate into trade wars or military conflicts.
October has a history of increased volatility, often called the "October effect." This can be attributed to factors including investor behavior, earnings reports, and past market crashes in October. This pattern can become a self-fulfilling prophecy as investors anticipate a crash, leading to selling and ultimately causing prices to fall.
The gains from the SPX500 mainly come from the mega tech companies with high P/E ratios. I am unsure if they will succeed in materializing such expected earnings, as people believe these companies, such as Nvidia, will grow into their earnings.
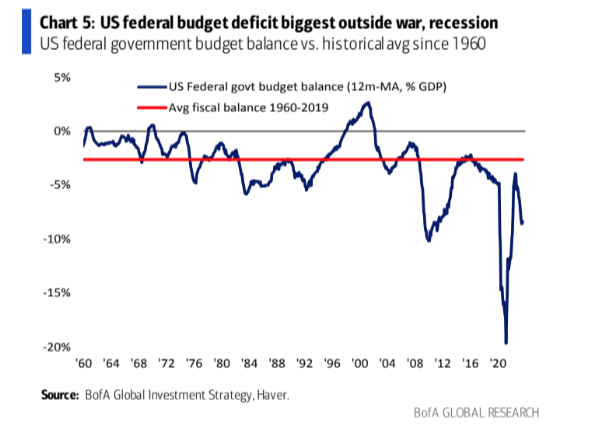
As rates remain elevated for a prolonged period (Higher for longer), the impact of the landing could be dramatic and perhaps not as soft as people think.
If there's a next recession, rates might actually jump instead of dropping, since the market discounts a terminal fiscal policy panic.
Fiscal Policy Panic refers to hurried government actions, such as altering tax rates or spending, which may be poorly thought out.
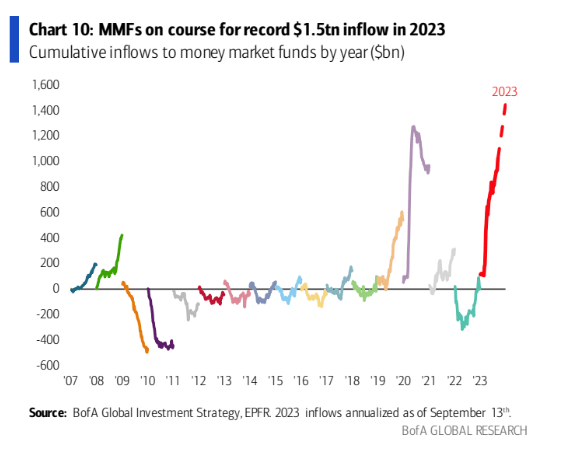
In 2023, there has been an influx of $1 trillion into money market funds, and if this trend continues, it's projected to reach a record-breaking $1.5 trillion over the course of the year when annualized. Money market funds (MMFs) are cash or cash equivalents. Cash is king again?
Additionally, a historical pattern of volatility increasing in October is known as the "October effect." This phenomenon is attributed to various factors, such as seasonal changes in investor behavior, earnings reports, and market crashes that happened in October in previous years.
I believe there is an opportunity to profit from a rise in volatility using different investment strategies and hedging techniques. In our monthly series, we explain how we use our proprietary model to assess the current state of volatility and its relation to economic indicators and option prices.
So, here's some guidance on how to select different options strategies for short-term and long-term exposure to volatility and protecting against extreme market events.
This will be a long read, so idk pop your (ar)modafinil, Ritalin, Adderall, concerta, Vyvanse, or whatever you use, rub one out, and focus. If you skim, GFY
VIX
I will be just taking this part from my previous newsletter
The VIX, or the CBOE Volatility Index, is a financial indicator that tries to measure how much the stock market is expected to move in the near future, specifically over the next 30 days. It focuses on the S&P500, one of the stock market indexes that includes 500 of the largest companies in the U.S. and is often considered a good representation of the overall U.S. economy.
First of all, "volatility" in financial markets refers to the degree of variation of trading price series over time. Higher volatility means that the price can change dramatically in a short period. Low volatility means that the price changes are more gradual.
Fear
VIX is often called the "fear index" or "fear gauge" because it tends to rise when market participants are uncertain or worried. When market participants are less certain about the future and expect more volatility (more ups and downs with magnitude). That's why a high VIX often correlates with a market decline. However, this is not always the case.
I prefer to call it the "uncertainty index" instead of fear. VIX can go up together with SPX500 going up, as there can also be "fear" for the upside for the market makers/dealers' perspective.
However
The VIX is calculated using the prices of options on the SPX500 index. We all know what options are at this point, and if you still don't, I recommend reading my educational articles about it.
When market participants expect high volatility, they're willing to pay more for options, which can act as a form of "insurance" against large moves with magnitude. Personally, I don't think that comparing it to insurance is great, but alright, that's what the textbooks say...
VIX rule of 16 (quick tip)
Have you heard about VIX Rule 16?
This enabled you to estimate a daily move.
If let's say, VIX is at 32
32/16 = 2
The market is pricing in a 2% move in the SPX500
If the VIX is at 14, you can do 14/16 = 0.875
The market is pricing in a move for 0.875% for that day in the SPX500
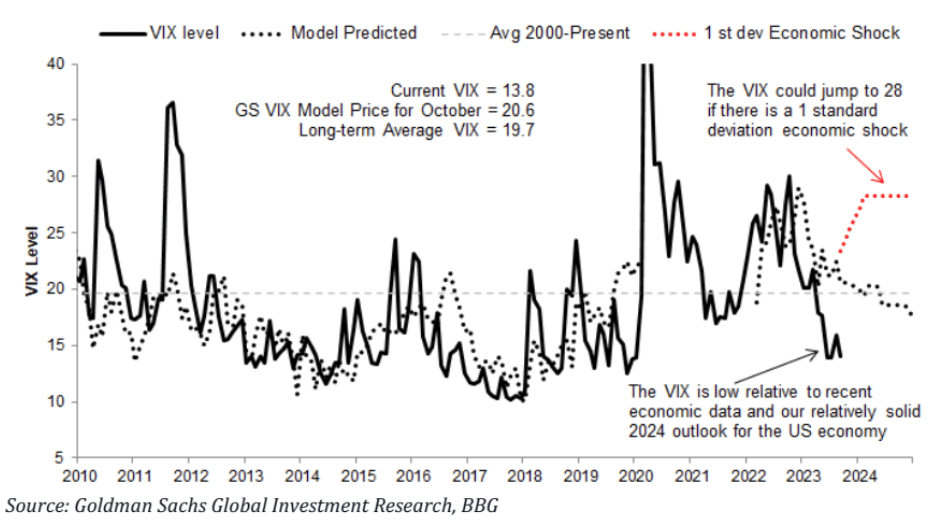
The VIX is currently at a low level despite compared to its historical average and the economic data
The VIX is low when you look at its past levels and also in the context of current economic indicators. A low VIX usually suggests that the market is not expecting a lot of volatility, which prompts market participants to sell calls & puts as they try to earn the premium (betting against volatility,).
The low VIX shows market participants are optimistic or perhaps even too relaxed (complacent) about the state of the market despite the risks lurking behind the shadows.
Not to forget all the potential risks that could disrupt the economy, like unexpected inflation, a mistake in policy by the Federal Reserve, or a sudden geopolitical event like a war.
If any of these risks materialize, the VIX could more than double and go up to 28, higher than its long-term average of 19.7.
According to Goldman Sachs's forecasting model, even without a major "shock," the VIX is likely to rise to 20 by October. This model considers various economic indicators, like GDP growth, unemployment levels, inflation, and interest rates.
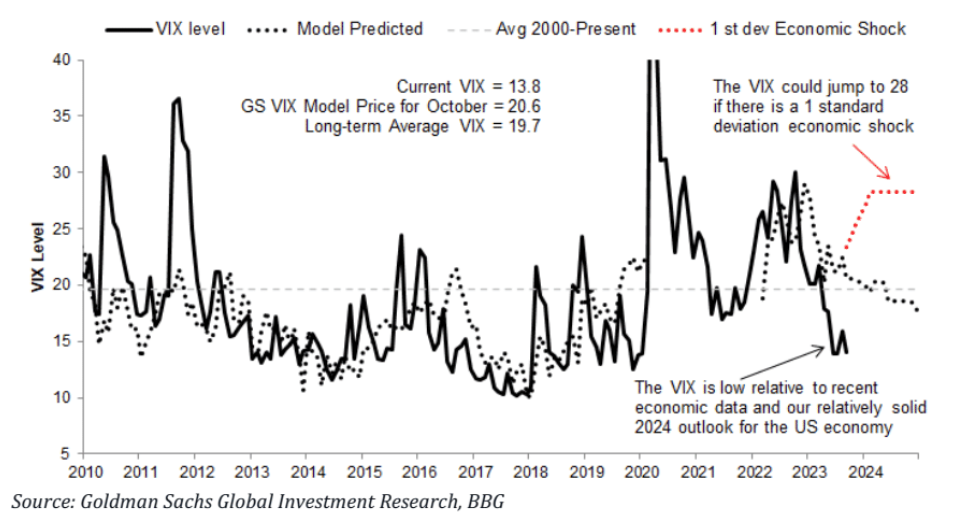
The model also keeps in mind how the VIX has behaved in the past during different economic cycles. Usually, the VIX is higher (or "elevated") during an economic downturn and lower during periods of economic growth.
Economic growth, I am skeptical about. It doesn't seem like the Federal Reserve will cut interest rates anytime soon, as they mentioned during their Jackson Hole speech "Higher for longer."
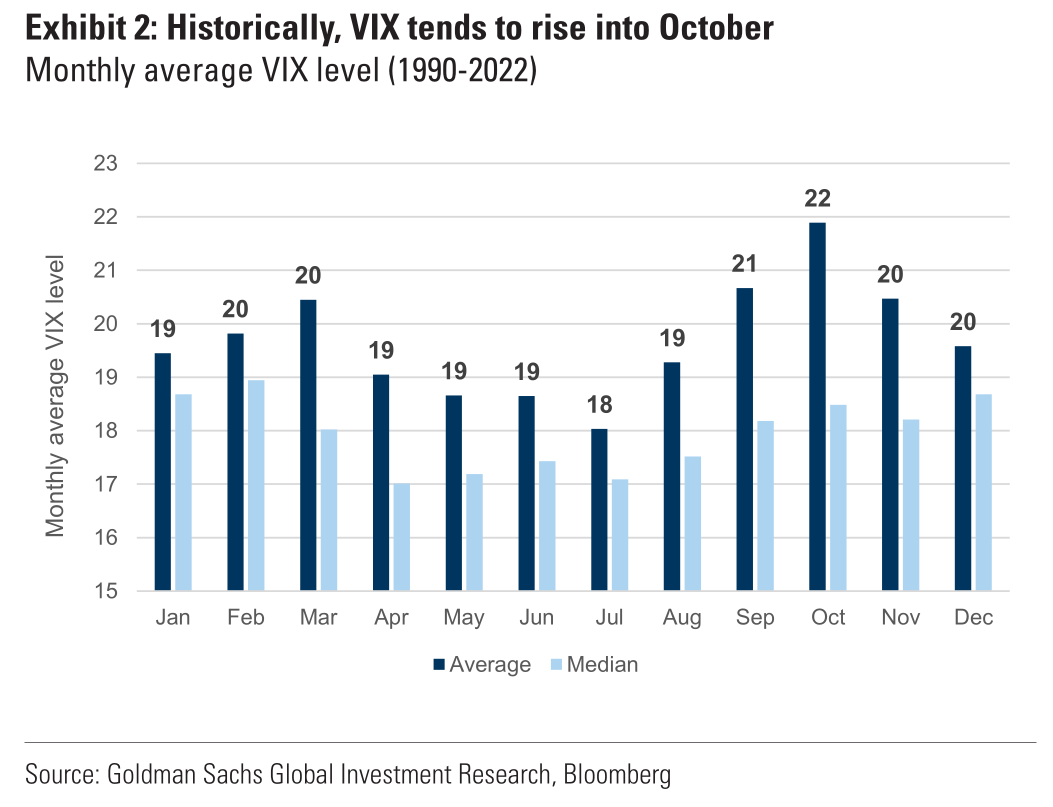
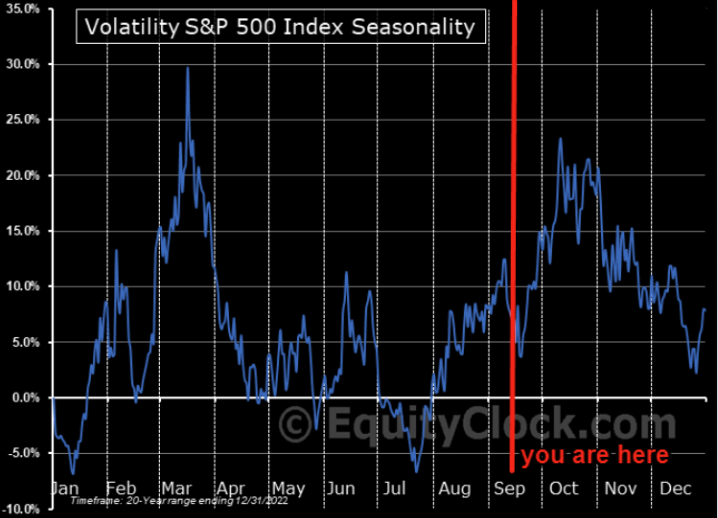
VIX seasonality
VIX tends to rise about 16% from September to October, based on more than 30 years of historical data. We could see higher volatility levels soon, especially considering that the VIX is now at multi-year lows (as of writing September 15, 2023).
There's a consistent trend of rising volatility from August to October across major financial indexes. A seasonal uptick is likely due to market participants, funds, and companies adjusting to improve their year-end performance.
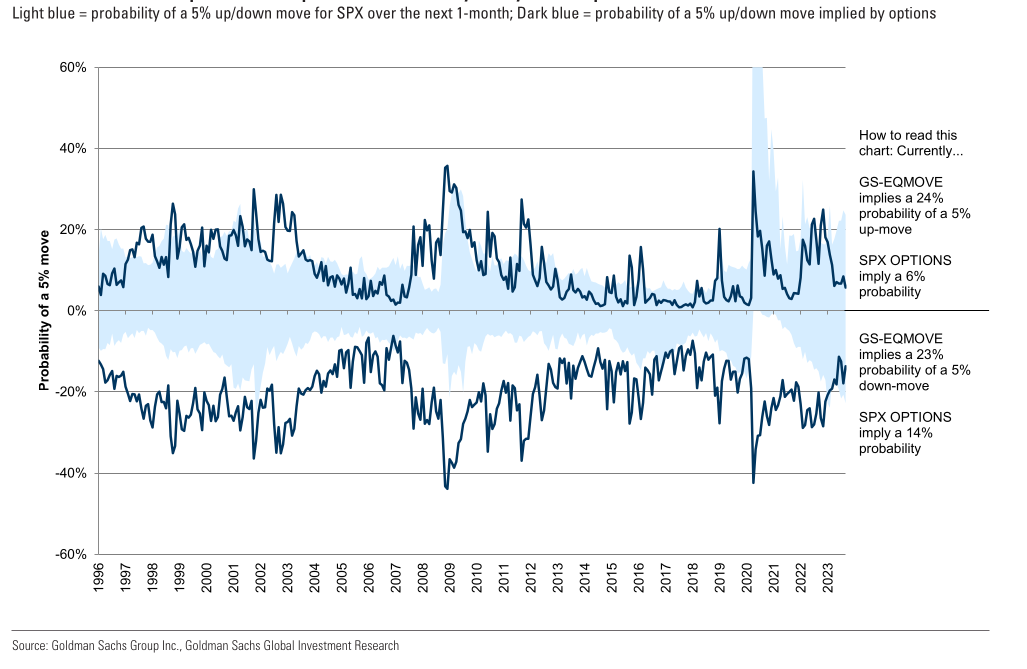
GS EQMOVE
GS-EQMOVE evaluates the asymmetry of market movements both upwards and downwards. The model suggests that both upside and downside moves are underpricing, meaning they are more likely to happen than what the current option pricing implies.
- Light blue: Represents the actual probability of a 5% upward or downward movement in the SPX500 over the next month
Dark blue: Represents the probability of the same 5% movement as implied by pricing of SPX options.
According to Goldman Sachs EQMOVE
- There's a 24% chance that the SPX500 will experience a 5% move up
- Also 23% chance of a 5% move downwards
In contrast, SPX options pricing implies:
- A 6% chance for a 5% move up
- A 14% chance for a 5% move down
The GS-EQMOVE model shows that the market underestimates the likelihood of a large price swing in both directions. The probabilities implied by SPX options are lower than what GS-EQMOVE predicts, so there might be attractive opportunities in both upward and downward market movements.
GS-EQMOVE implies that both upside and downside asymmetry are underpriced
IF YOU ARE SKIMMING THIS, GFY
Trade recommendation
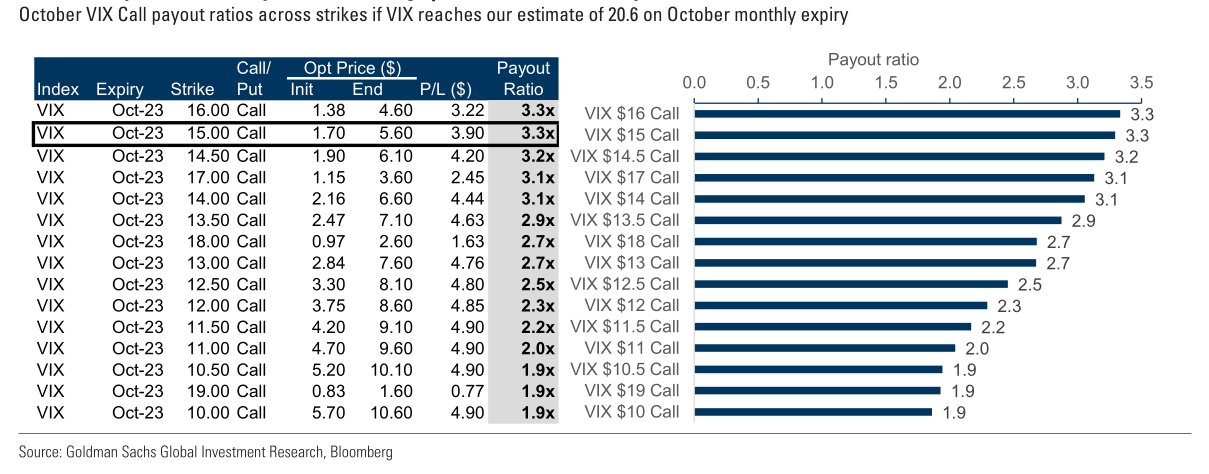
Buy VIX October monthly expiry $15 calls to protect yourself against downward market volatility. The recommendation is based on Goldman Sachs volatility model, which anticipates a jump in VIX levels. Additionally, the October seasonality gives this trade another edge.
Here's an analysis of different VIX call options for October, which one could offer the maximum payout, assuming VIX reaches the projected volatility levels by or before the expiration date. Yes, you can sell before expiration.
It's important to remember that if VIX closes below $15 strike at the expiration date, your maximum loss in the premium.
It's also worth mentioning that VIX does not have to reach the $15 strike price to profit.
You can make money from an option trade without ending at the strike ("in the money"). All that can be necessary is a repricing of risk.
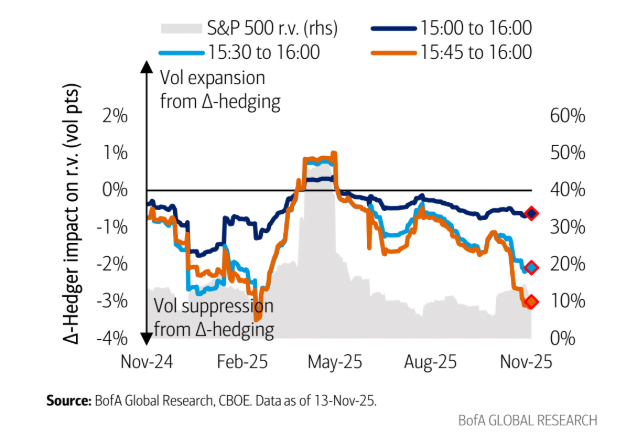
Tactical hedging
In this section, we will go over some tactical hedging strategies for certain types of risks. These risks include the possibility of tech stocks losing value, changes in interest rates, and fluctuations in the growth of the U.S. economy.
To decide which tactical hedge to use, we first need to understand how much the specific risk influences an asset (like a stock or an ETF) we're trying to protect against. That influence is the "sensitivity" or "beta."
We have to look for assets whose price changes have been consistently linked to targeted risk over time rather than during specific events in the past that may not repeat. Many market participants seem to be underestimating these risks.
The implied volatility for tech stocks, Treasury bonds, and the general stock market is low. That means people aren't expecting moves with magnitudes and shocks, which could be a costly mistake.
So, let's go over the steps.
- Estimating Beta: Calculate the "beta" for each stock, ETF, and Index. Beta measures these assets' sensitivity to risk factors such as interest rates or tech stock performance. This can be done by looking at weekly changes and risk factors over the past 3 years.
- Liquid options & minimum correlation: Focus on assets that have liquid options so they're easy to enter and exit. It also ensures that the risk we're trying to hedge against can be easily traded.
- Least expensive options: Once the other criteria are met, the next step is identifying which options are the least costly relative to their beta.
The main objective is to find options that offer a good "deal" for hedging against risks. It's important to note that he assumes past behavior and does not indicate future results.
Are you a premium newsletter member but still haven't joined Discord?
Join Discord to get the full value out of the newsletter. There's no extra cost associated with Discord. Yes, options data, such as dark pools, options gamma, unusual flow, etc., are also included. Also educational content, reports, and direct questions to me, and often I share my trades & thoughts in real-time as the market moves. However, I want you to understand rather than just copying a trade

Why Options instead of futures?
Let's go over the basics
Derivatives are financial contracts whose value depends on the price of another asset, known as the “underlying.” Different types of derivatives trade at various levels of complexity, from simple futures contracts to exotic option contracts.
Most derivatives fall into one of two categories.
- linear derivatives
- nonlinear derivatives.
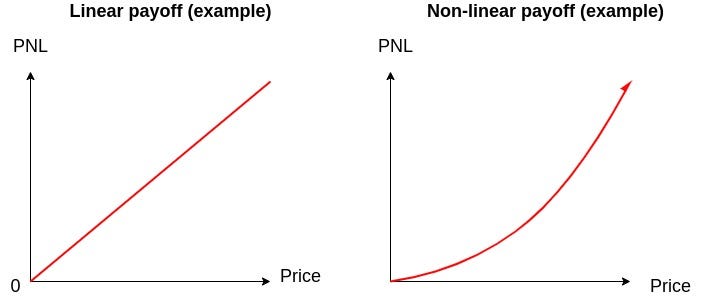
Linear vs. Non-linear payoff
Linear derivatives are simple to hedge. Nonlinear derivatives are unstable and need delta hedging or dynamic hedging.
The value of linear derivatives is directly proportionate to the underlying asset. A linear derivative would be a “futures contract” with the underlying asset being the stock.
A nonlinear derivative would be an option contract, which offers the holder the right to buy or sell the shares at a specific price at a certain time.
Nonlinear derivatives are more complex, and their value is not directly proportional to the underlying asset. For instance, a nonlinear derivative could be a credit default swap, which is a contract that pays out if the underlying asset (usually a bond) defaults.
A derivative helps us understand how the value of a function changes. The derivative of a function tells us how the value of a function changes as we change the input.
A nonlinear derivative is a derivative whose parameters are not linear. That indicates that the function responds nonlinearly to changes in the input.
Risk management rule: The prices of all nonlinear derivatives are time-dependent.
So, the risk management rule says that prices of all nonlinear derivatives change over time because of the “gamma” risk consideration (more generally called convexity).
The non-linearity exists because of “gamma,” and it needs to be combined with “time decay” (the “rent”) when pricing these derivatives.
That is because gamma convexity causes the price of the derivative to change over time, even if all other factors stay the same. So, we must consider this “time dependence” when pricing nonlinear derivatives to ensure they are accurate. Such as an option contract.
Tech Drawdown Risks
Right now, tech stocks are performing well, especially XLK, up by 35% for year-to-date, but it's important to wonder what will happen if there's a sudden pullback in the value of tech stocks.
Tech stocks have stretched valuations and low volatility at the time of writing. Their current price might be higher than what they're fundamentally worth, and a lot is based on speculation that they will grow into their P/E ratio.
Also, the low "implied volatility" indicates that the market doesn't expect big price swings in tech stocks. Both of these factors make it a good time to think about hedging.
Another approach is to look at which stocks and ETFs have shown the greatest correlation to the tech sector over the past 3 years. These assets will likely be the most effective hedges if tech stocks fall.
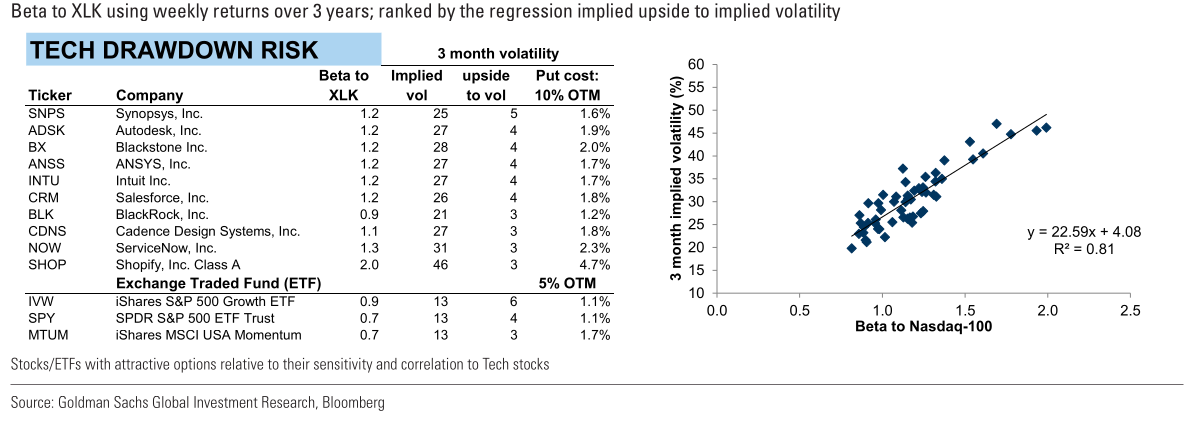
Also, look for assets with a high beta and a low "beta-adjusted implied volatility," which means we're looking for relatively cheap options when considering how effective they would be in offsetting tech stock risks.
Lastly, rank different U.S. listed options based on their sensitivity to changes in the tech sector (sensitivity to the factor) and how much they cost in the options market to identify the best or most cost-effective options for protection against a pullback/fall/plunge in tech stocks.
Beta to XLK using weekly returns over 3 years; ranked by the regression implied volatility to implied volatility.
Rates risk
The Federal Open Market Committee (FOMC) is responsible for setting the interest rates in the U.S., as most of you know. The FOMC is unlikely to raise rates at their upcoming September meeting (You're probably reading this later because this takes a long to write).
They may even decide not to raise rates for the rest of the year, mainly because of core inflation (which excludes volatile items like food and energy) seems to be slowing down.
Some economists predict that the first rate cut will likely happen in the second quarter of 2024 as they expect this cut when the PCE (Personal Consumption Expenditure) inflation is below 3% year-over-year.
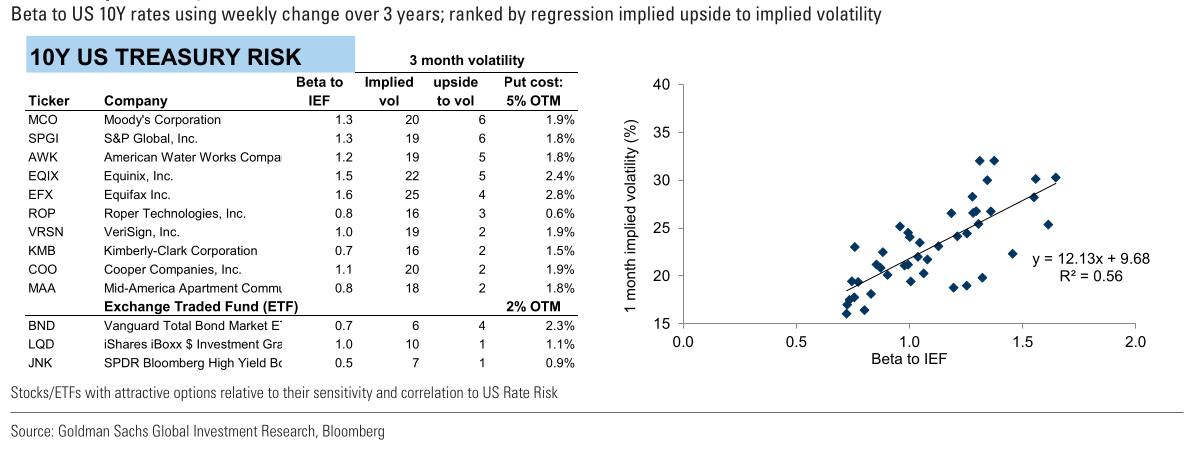
Also, we have to look at options of stocks and ETFs that are best for protecting against this uncertainty of interest rates. We have to look at assets that have shown strong sensitivity and correlation to the U.S. Treasury bonds over the past 3 years.
Hedging on stocks and ETFs with a beta greater than 0.7 to 10-year U.S. Treasuries and a correlation greater than 25% means they're likely to move in a similar direction as Treasury bonds, making them effective hedges against interest rate risks.
Beta to US 10Y rates using weekly changes over 3 years; ranked by regression implied to upside volatility.
US Growth Risk (GSSBCYCL vs. GSSBDEFS)
GSSBCYCL and GSSBDEFS are investment indexes. These indexes are designed to track the performance of certain segments of the financial markets.
GSSBCYCL is based on an acronym for cyclical companies that tend to do well when the economy is growing and suffers during downturns. These often include companies in sectors like retail, travel, and construction.
GSSBDEFS is based on defensive sector indexes. Defensive sectors are relatively immune to the economic cycles and include essential industries like utilities, healthcare, and consumer staples (e.g., food and household items).
- In a bull market or economic growth phase, cyclical stocks (GSSBCYCL) usually outperform as consumer spending increases.
- In a bear market or economic downturn,, Defensive stocks (GSSBDEFS) might be expected to outperform or at least fall less, as these sectors often provide.
Investors often shift their allocation between cyclical and defensive sectors based on their economic outlook for economic growth or downturn.
Goldman Sachs economists recently reduced their estimates for the likelihood of a recession in the next 12 months from 20% to 15%. That's a much lower estimate than the Bloomberg consensus, which places the chance at 60%.
Goldman Sachs is more optimistic than other experts about the GDP growth for the U.S., expecting an average growth rate of 2% through the end of 2024.
According to Goldman Sachs, things like disposable (money people have after taxes etc) are expected to increase in 2024; an optimistic view is backed by expectations of continued job growth and an increase in real wages (adjusted for inflation)
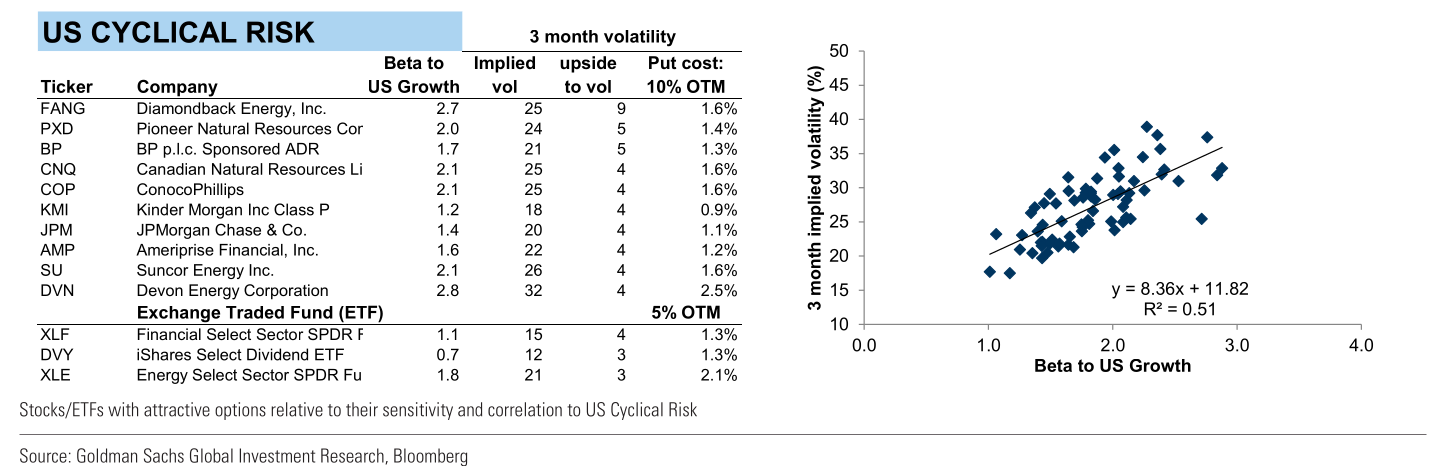
For those still concerned about the potential slowing of U.S. growth, stocks like FANG, PXD BP, and ETFs like XLF, DVY, and XLE are highly sensitive to high beta and correlated to economic growth factors.
Beta to GSSBCYCL vs. GSSBDEFS using weekly returns over 3 years; ranked by the regression implied upside to implied volatility.
Optimal hedges for US Cyclical/Growth risk
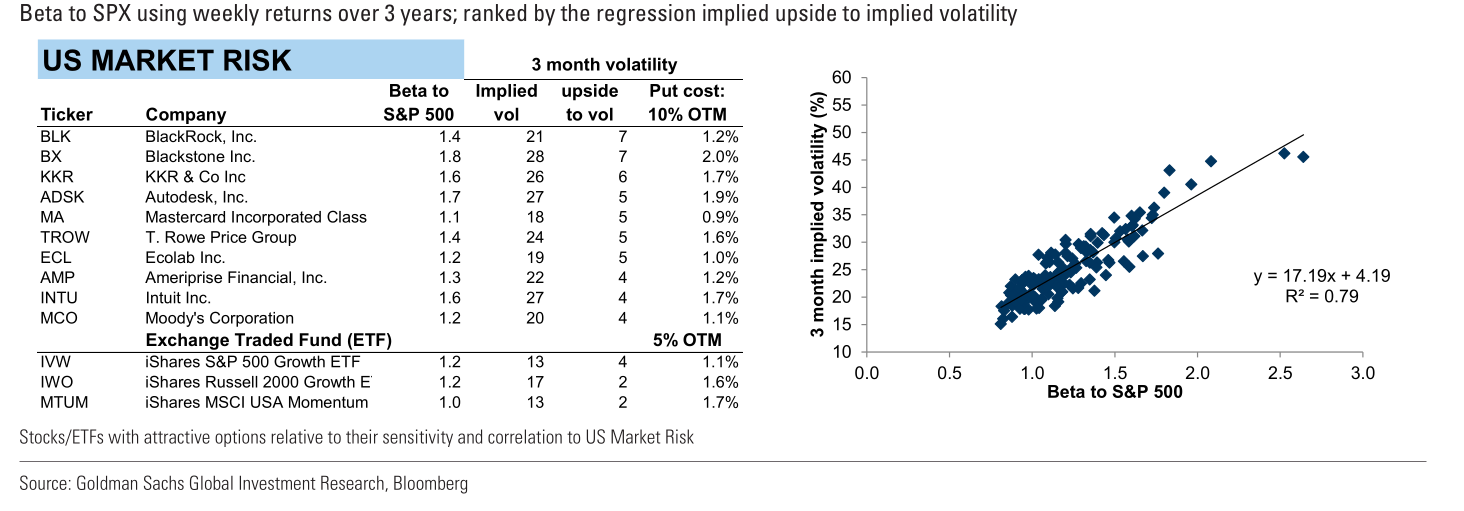
US market risk (SPX)
GS analyzes the relationship between beta and implied volatility for the SPX500. The beta measures how sensitive stocks or ETFs are to the movements in the SPX500, while implied volatility gauges the market expectation of how much the SPX500 is likely to fluctuate.
The idea is to find stocks and ETFs that offer the least expensive options in relation to their sensitivity (beta) to the SPX500, so we're looking for cost-effective ways to hedge against market risks.
It's important to note that this is not anticipating a drastic fall or tail event but the base case is a pullback.
Despite GS not expecting a steep fall, if you're concerned about a market downturn, "put options" on certain stocks and ETFs may be a good strategy. Remember, as hedging purpose.
The stock and ETFs recommended for these put-buying strategies have both high beta and high correlation to the SPX500, so they're sensitive to movements in the broader market or SPX500, making them likely to perform well as hedges if the market does pull back.
Optimal hedges for US Market risk
Systematic Hedging
GS 27-year study, focussing on different hedging strategies, specifically for the SPX500. Their study covers 27 years and looks at different strategies for balancing risk in a portfolio that includes equities. The SPX500 is used as a representation of the broader equity market.
Just to refresh everyone's memories.
- Long puts: You buy a put option to protect against a fall in price in the underlying. There's theta decay to pay, so you need a move with magnitude.
- Put spreads: This strategy involves buying and selling put options at different strike prices. This helps against the Theta decay but limits your profits' upside.
- Put spread collar: This is a more complex strategy that involves multiple options and can offer different kinds of protection and profit scenarios.
If you need a reminder on Theta decay (skip this is if you're already familiar)
The “time value” measures the option’s odds of increasing value due to the passage of time and becoming “in the money.”
As time goes on, the option contract could increase in value and become “in the money.”
So “time value” refers to the probability that an option’s value will increase as time passes. The longer until the option’s expiration, the greater the time it will become “in the money.”
The value of options contracts tends to diminish as they approach expiry, due to the effects of time value decay.
The closer the option contract gets to the expiration date, the higher the “time value decay” is.
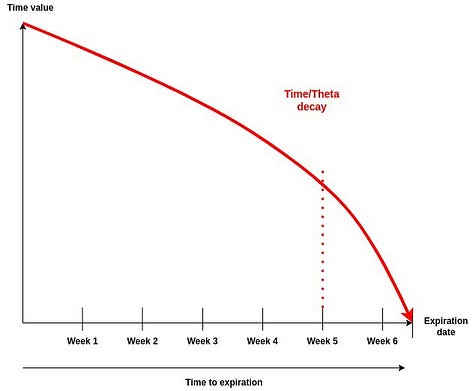
Time decay/Theta
That’s because there is less time remaining for the underlying asset to move enough to make the option contract swing “in the money.”
Time value decay is a key consideration when trading options contracts.
If you buy options contracts, your “theta Θ” or “time value” is negative. That means the option contract is losing value over time as expiration nears.
Theta is a measure of an option’s time value. When you’re buying an option contract, your theta is negative.
The option contract loses money over time as expiration nears. So if you’re holding an option contract, you’re losing money as time passes.

The closer you get to expiration, the greater the chance your option will expire worthlessly.
That is related to “theta decay,” which is the gradual loss of value of an option over time. As expiry approaches, “theta decay increases”, meaning the value of your option contract value erodes faster with increasing magnitude.
In addition, the time decay accelerates as your option contracts approach “At the money” (ATM)
Therefore, “theta decay” refers to the deterioration of an option’s value over time. As expiry approaches, theta decay increases, meaning the value of your option contract drops at a quicker pace.
The closer you are to expiry, the greater the likelihood that your option will expire worthless since the option contract will have less time to recover its value.
The theta decay is becoming larger in magnitude, but it is also becoming more negative in direction.
As we get closer to expiry, the theta decay will be more negative. For example, it might start at -0.003 but be -0.1 by reaching the expiry.
Also, you can read more about options here
These strategies can offer a foundational understanding for those who want to create their own hedging but systematically.
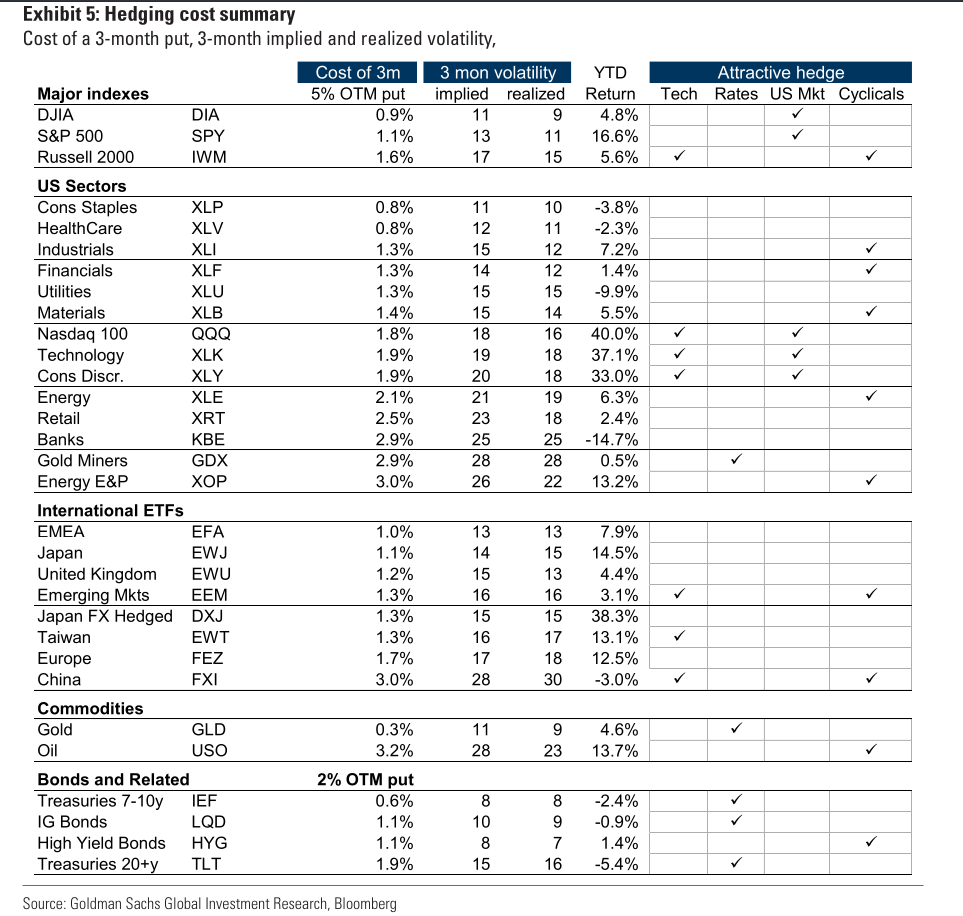
Hedged equity strategies have returns and volatility between Bonds and the SPX
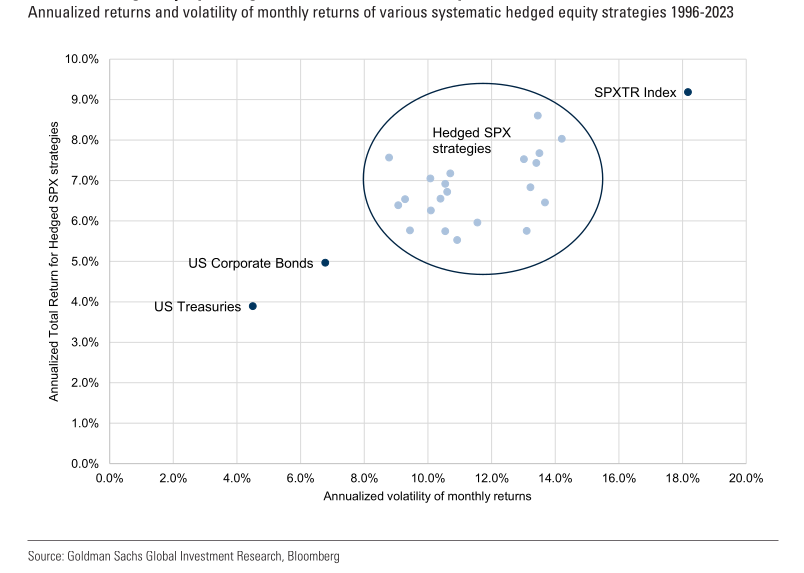
- Positive returns with Put Spread Collars: In a year (2022) where both stocks (represented by the S&P500) and bonds had negative returns and equity invested was hedging using a "12-month put spread collar" strategy actually yielded positive returns!
The Put Spread Collar options strategy involves buying/selling different options to create a "collar" around the equity/future/underlying position, which aims to limit potential gains and losses.
Over the 27-year study, the Put Spread Collar strategy yielded the highest risk-adjusted returns, mainly due to the performance of selling options as part of the strategy.
Put spreads are generally cheaper to execute. However, put spreads have been less effective than Put Spread Collars in terms of risk-adjusted returns.
Simply buying outright "long puts" had the least favorable risk-adjusted returns, mainly due to the high cost of buying these options, especially when they're 5% "Out of the Money" and the Theta decay that comes with it. Again, with 5% OTM puts, I mean strikes that are 5% below the current market price of the underlying.
Only 2 hedged equity strategies produced lower returns, adjusted for volatility, than simply investing in the S&P500, and these two are "Long put 1m roll" and "Put Spread 1m expiry 1m roll"
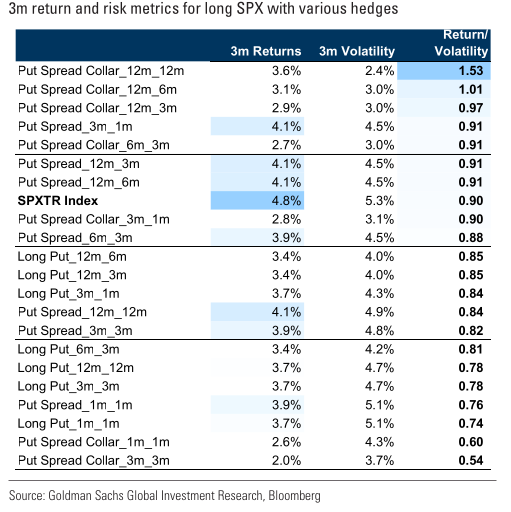
Comparing SPX systematic hedging strategies
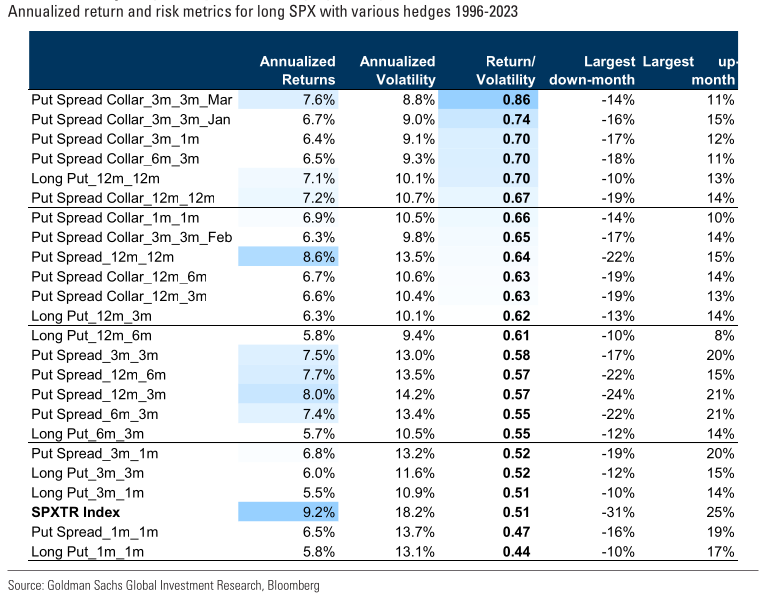
Types of Hedging Strategies
- Long Put: Buying a put option with a strike price that's 5% below the current market value of the underlying or 5% OTM. It's a straightforward way to hedge against a fall in the underlying asset.
- Put Spread: In addition to buying a 5% out-of-the-money (OTM) put, sell another put option that has a strike price 20% below the underlying market value (20% OTM), which limits both the cost but also the maximum gain from the hedge.
- Put Spread Collar: similar to the "put spread" but with an additional component. Selling a call option to offset the upfront cost, effectively making the initial outlay zero.
Zero Upfront Cost: Selling a call option helps to balance the cost, so you don't have to pay much or anything upfront
Duration and Rolling of the Hedge
The first number refers to the time period of the hedge will be active (duration of the hedge)
The second number indicates how often the entire amount (notional) in the hedge is refreshed or "rolled" to the new option with new strike prices and expirations.
Okay, that might sound confusing so here's an example.
- Put Spread Collar_6m_3m: A put spread collar strategy that lasts for 6 months and is rolled every 3 months. When it's rolled, new strike prices and expiration dates will be chosen for the options.

You probably understand the table better now.
Hedging Performance
When we both consider return and risk, put spread collar strategies did better than simply owning the S&P500 stocks. That's largely due to a decrease in market volatility which benefits the hedging strategies.
The Risk-Adjusted Basis takes into account not just the returns but also the level of risk involved. Higher returns with low risks are generally seen as better if you want to protect yourself against market pullbacks/falls/crashes.
When market volatility falls, option strategies like put spread collar outperform well.
Despite the risk-adjusted outperformance of put spread collars, the S&P500 generated a higher total return than all these hedging strategies combined. This is however biased since most of the time we have been in a bull market with easy credit, share buybacks, and the most "mean revertive" markets of the past 12-15 years. Markets haven't always been that way when looking back over 100 years.
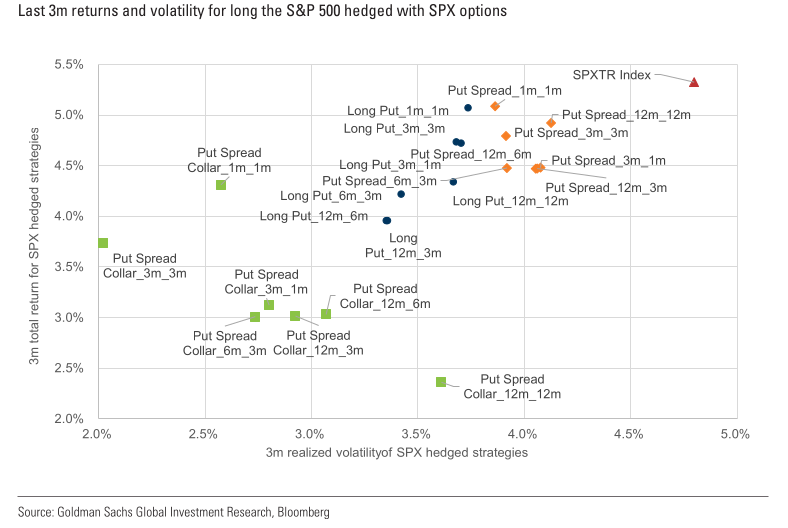
Here we can see a comparison, of the total 3-month return of the S&P500 against the different hedging strategies.
S&P 500 continues to outperform hedged strategies if we are focussing on pure gains and leave risk-adjusted out
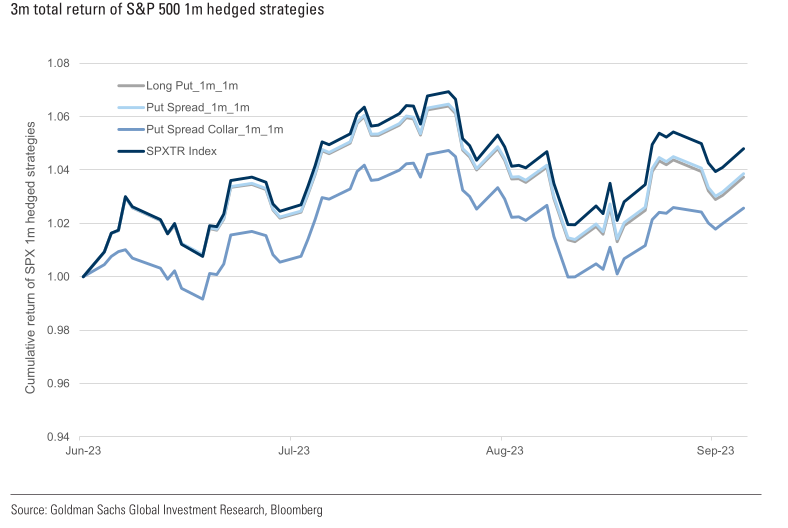
Systematic hedging strategies underperformed over the past 3m as SPX continued its upward
So, don't expect these hedges to outperform the SPX500 in a face-ripping bull market. The 27 years look back is biased since most of the data is a bull market with muted volatility but this can be really useful if we actually expect the market to pull back, considering all the risks that are going on as the Federal Reserve keeps rates HIGHER FOR LONGER
Landing: LONGER & HARDER?
A landing... if any. Right now we are still in the sky
ApeX DEX
ByBit has made KYC mandatory as many other exchanges. Why not try out ApeX DEX? You can use your wallet or social account to use the DeX. No gas fees are required for trading & the fast trading experience is like a CEX.
Consider ApeX DEX
Instructions:
https://twitter.com/RNR_0/status/1652360705331347461
For a lifetime fee discount, check the link
Signup: https://pro.apex.exchange/trade/BTC-USDC/register?affiliate_id=46&group_id=83
Ref code: 46
Also, you can use your socials like Gmail/Google, Discord etc to login on ApeX Dex if you're too lazy to many a wallet such as metamask or blockwallet