Uncovering Crypto Trends - Monthly On-chain & Market Analysis
This post will provide an overview of Bitcoin & ethereum, the two largest and most liquid digital assets by market capitalization. Covering a combination of on-chain data derived and data sourced from these assets' market dynamics, network activity, user behavior, and valuation metrics platforms and exchanges to analyze these assets' market dynamics, network activity, user behavior, and valuation metrics derived from Goldman Sachs notes.
Also, compare and contrast the performance of BTC and ETH with other BTC and ETH transaction fees returned to normal asset classes.
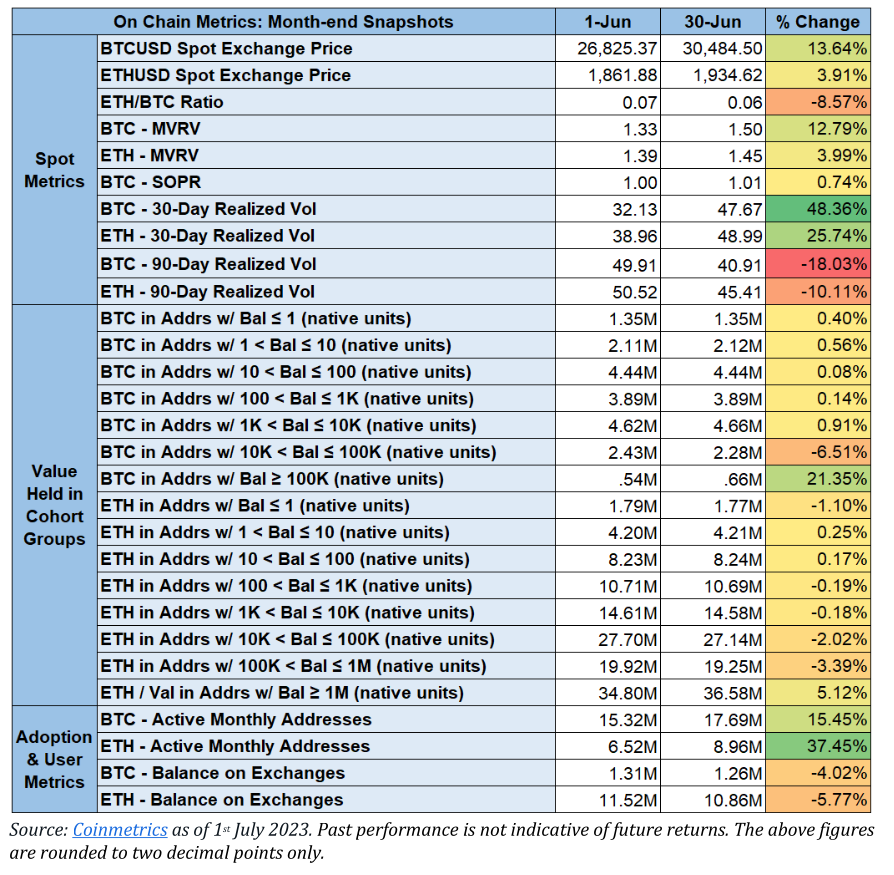
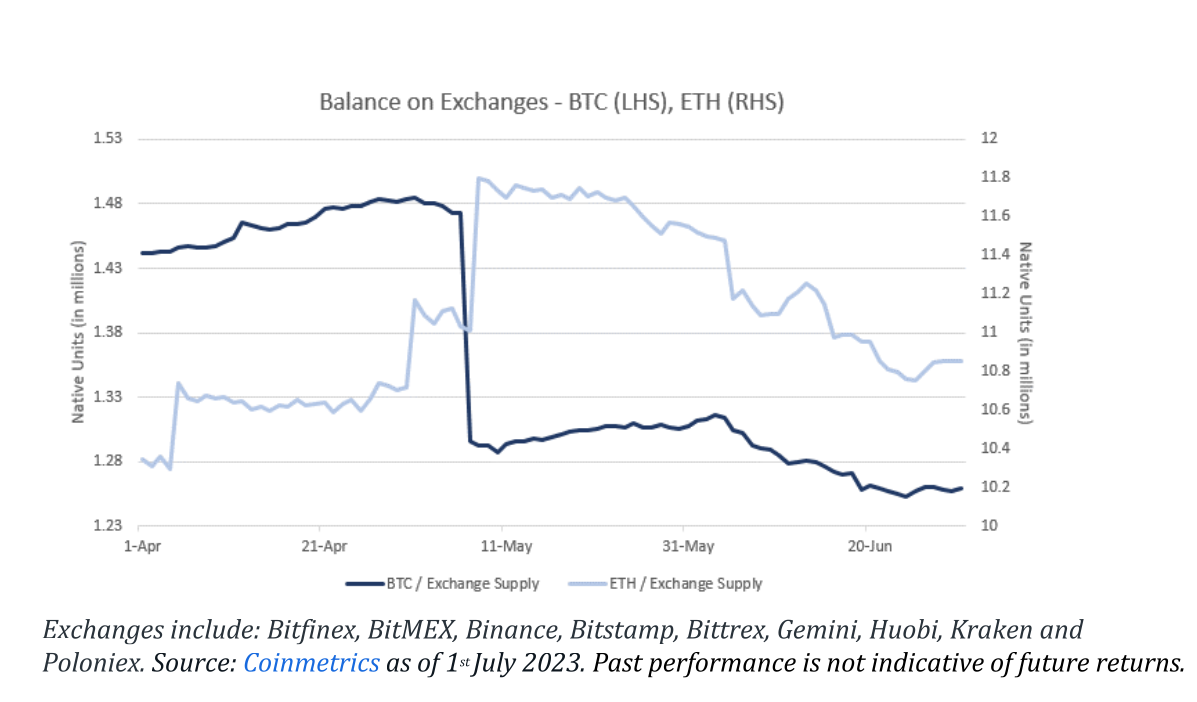
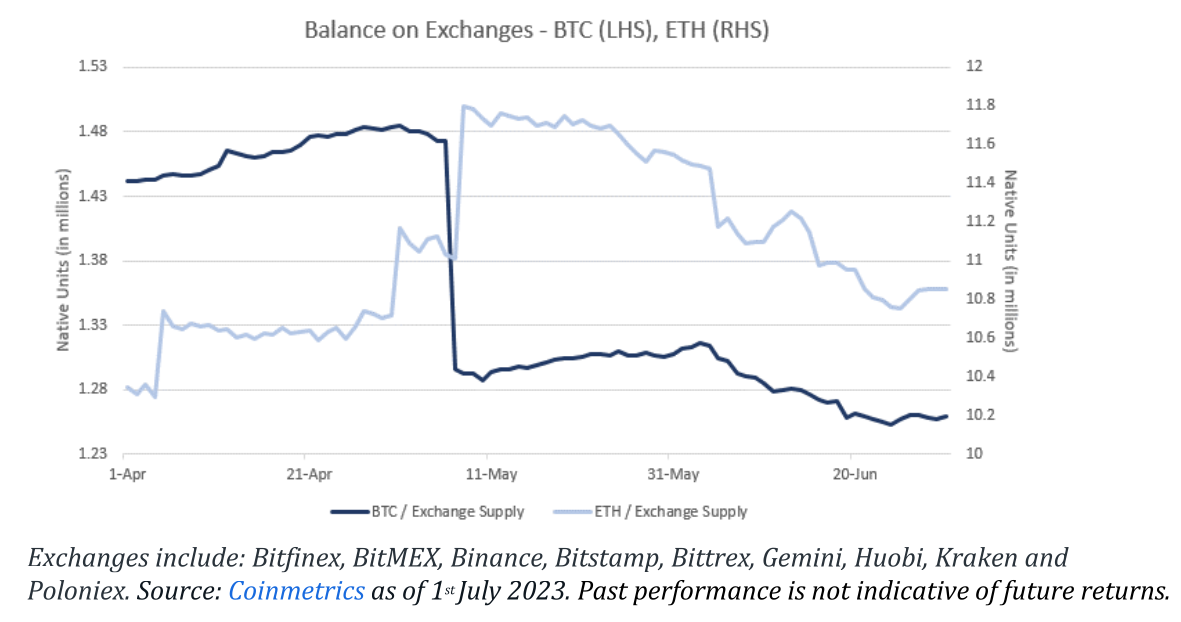
It seems that BTC and ETH have gained more trust from investors in terms of their long-term value, as shown by the consistent reduction in exchange supply. Investors appear to be less inclined to sell based on short-term price fluctuations and volatility.
In June, there was a decrease in the amount of BTC and ETH stored on exchanges, with a drop of 4.0% and 5.8%, respectively. This suggests that more people are moving their crypto from exchanges to alternative wallet options like hardware wallets and metamask.
We see a decline in BTC & ETH on exchanges for multiple reasons, as also pointed out by Goldman Sachs.
Regulatory headwinds for major centralized spot exchanges: The decreased exchange supply is likely a combination of a few major factors. Many centralized spot exchanges are facing regulatory headwinds, which has alerted investors. This is often the case, especially for exchanges operating in jurisdictions with stricter regulations. Due to elevated regulatory scrutiny, some investors may be withdrawing their cryptocurrencies from exchanges to prevent any possible complications.
Cyber hacks and theft: The issue of cyber hacks and theft remains a major concern in the crypto markets, emphasizing the importance of asset holders opting for self-custody in order to mitigate the risk of their coins being stolen or misused. This aligns with the well-known adage, "Not your keys, not your coins."
The phrase
"not your keys, not your coins"
is a popular saying in the crypto community, and it means that if you don't control the private keys to your crypto assets (which is the case when you leave them on an exchange), you don't truly control the assets.
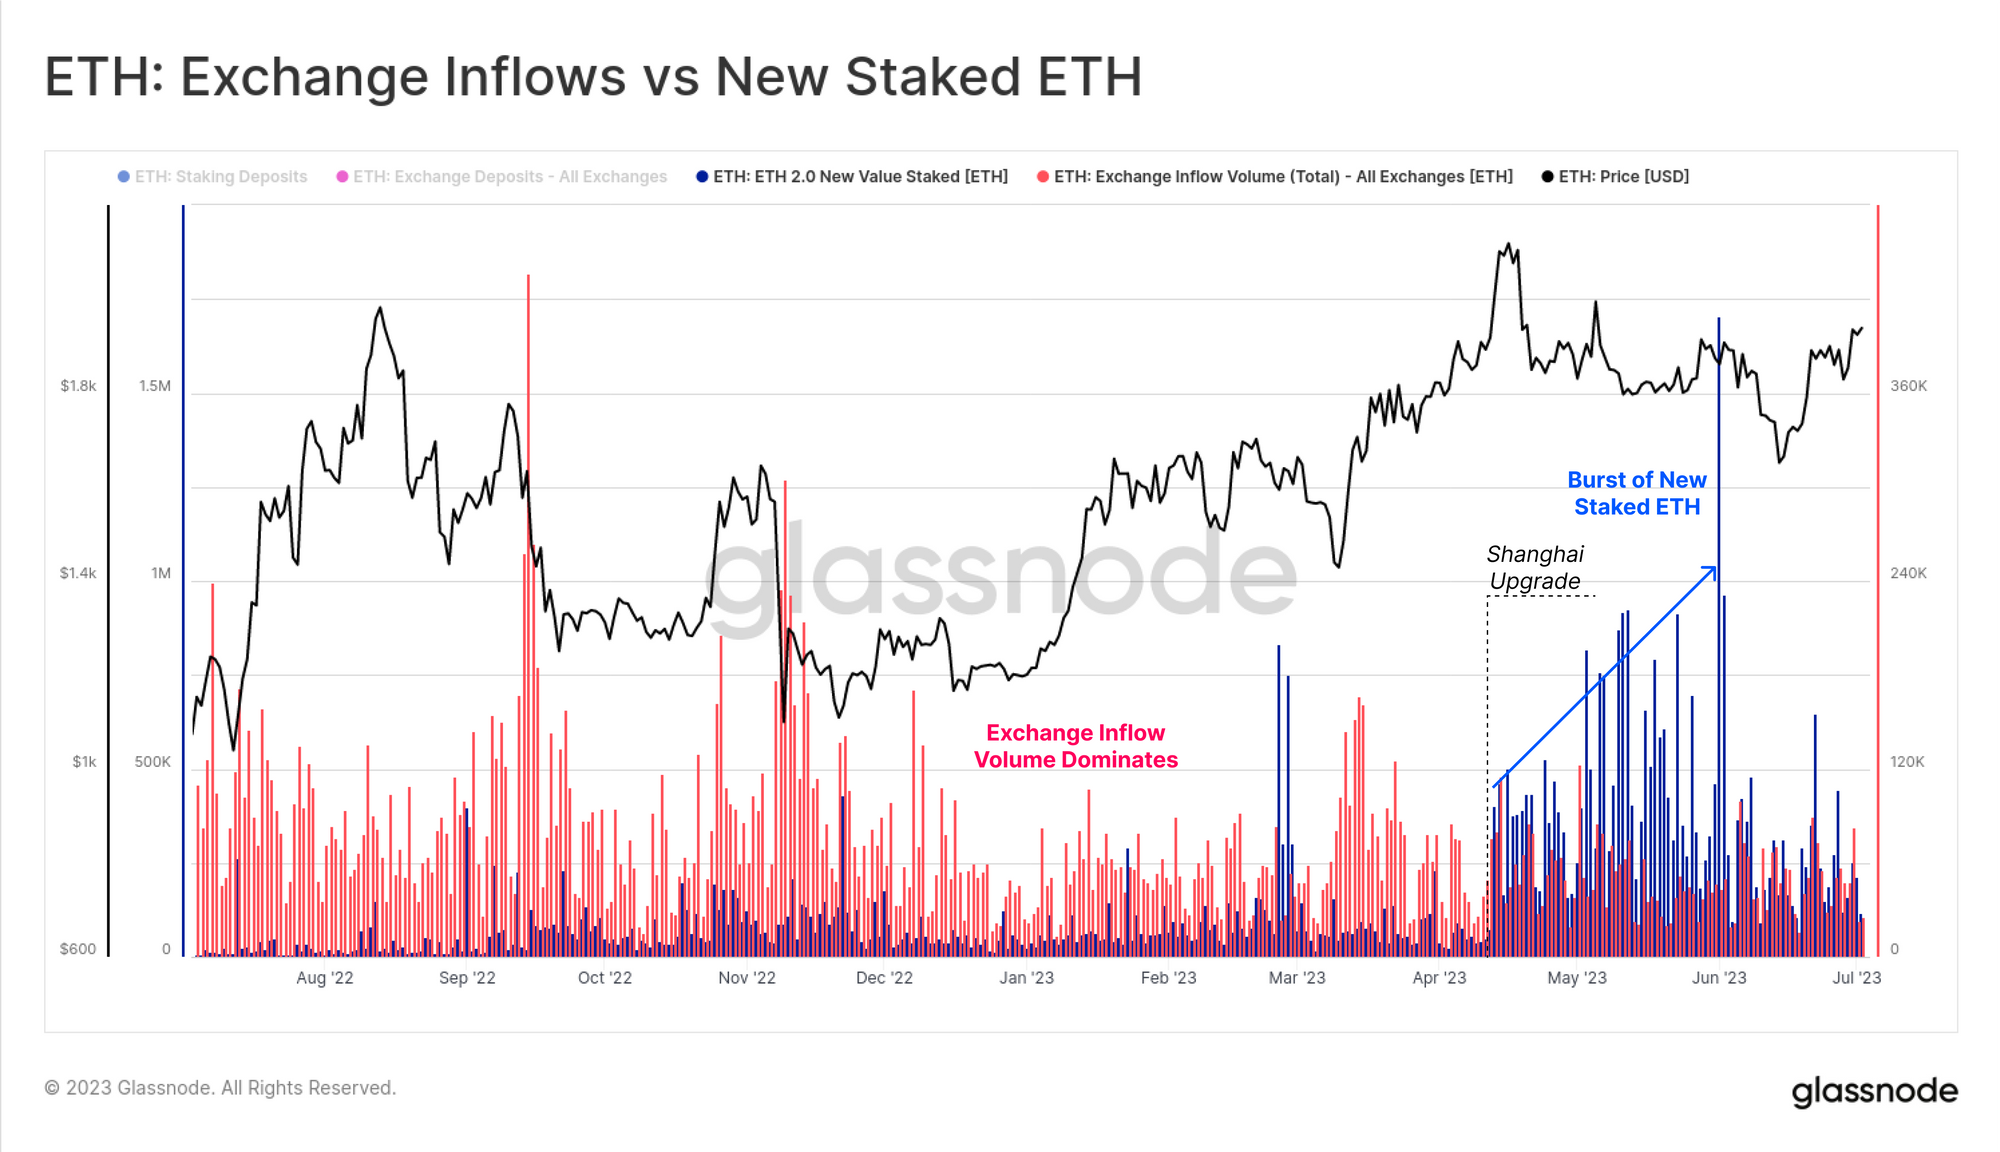
Staked ETH withdrawals & preference to stake
Additionally, the ability to withdraw staked ETH has likely influenced investors to prefer staking their ETH rather than simply holding it on exchanges. Investor confidence in the benefits of Ethereum staking is reflected in their willingness to stake and have the option to sell at their convenience.
So, to get more details. The other factor of ETH's decreasing exchange supply is the growing popularity of staking, which is a process of locking up ETH in a smart contract to secure the network and earn rewards.
Since December 2020, when Ethereum launched its Beacon Chain as part of its transition to a proof-of-stake (PoS) consensus mechanism, more than 6.5 million ETH have been staked, representing about 5.6% of the total supply. Staking ETH provides a passive income stream for investors, as they can earn an annualized yield of about 6%.
Moreover, since June 2023, stakers can withdraw their ETH from the Beacon Chain without having to wait for the merge of Ethereum 1.0 and 2.0, which is expected to happen by the end of 2023. This gives stakers more flexibility and liquidity options, as they can choose to sell their ETH on secondary markets or use them for other purposes.
So, in this way, holders of ETH can stake their ETH, which involves locking them up in a contract to help secure the network and earn rewards in return. With staked ETH withdrawals being enabled, more investors might choose to stake their ETH rather than leave it on exchanges, further reducing the exchange supply. The blowup of FTX exchange has made people more cautious.
Source: https://insights.glassnode.com/the-week-onchain-week-27-2023/
Before continuing to read, subscribe to the premium newsletter. The premium package also includes full access to my Discord.

The low price of $24.99 won't stay forever. It will be jacked up in the future.
Anyways you can continue to read further. The article does NOT stop here.
Transaction fees back to normal
The fees for network transactions on BTC and ETH are determined by the level of demand and congestion on their respective networks. This means that users have to pay higher fees in order to have their transactions confirmed faster by miners or validators.
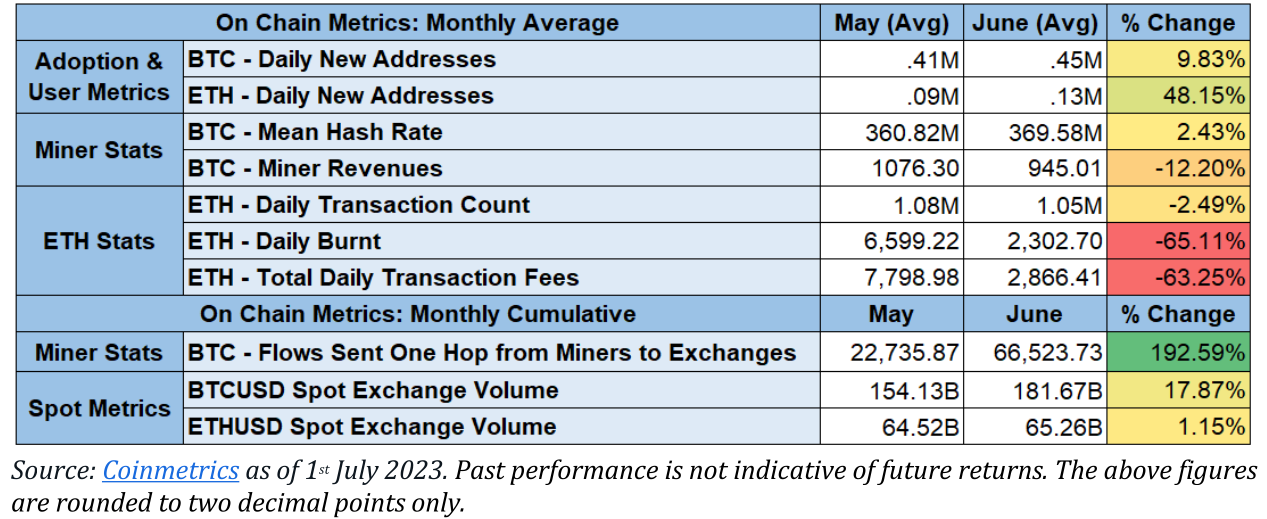
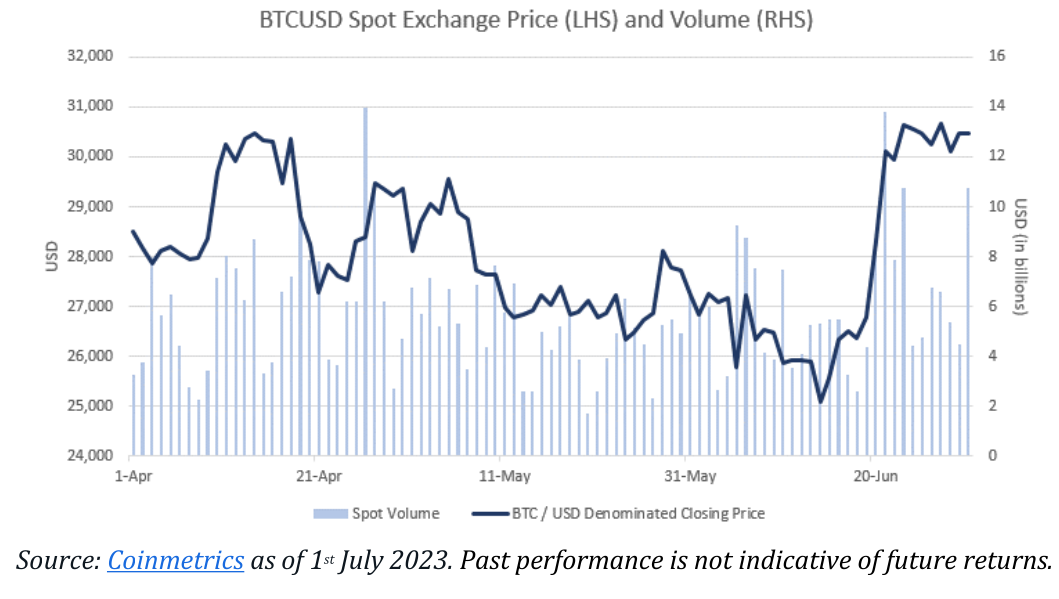
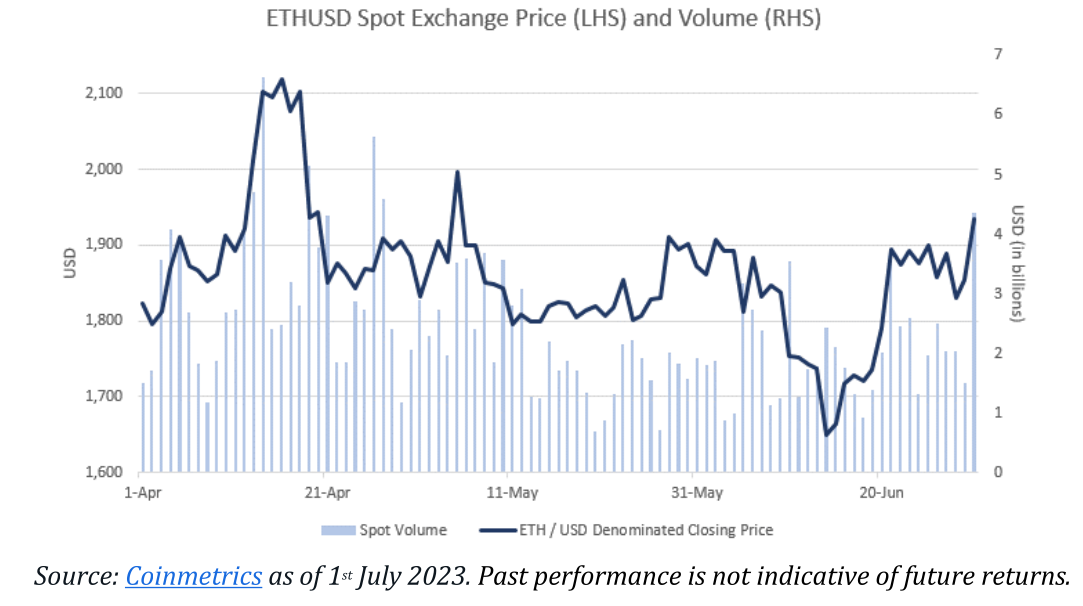
During May 2023, both networks encountered a surge in transaction fees caused by a combination of factors. These included heightened trading activity amidst high price fluctuations, a rise in the usage of DeFi protocols and stablecoins on Ethereum, and a decrease in hash rate on Bitcoin due to power outages in China.
Glassnode reports that the average transaction fee for BTC reached $62.77 on May 21st, while the average transaction fee for ETH hit $69.92 on May 19th. These are the highest levels recorded since April 2021.
In June 2023, the BTC and ETH transaction fees returned to normal as the network activity and congestion eased. Glassnode reported that the average transaction fee for BTC decreased to $6.36 on June 30th, and the average transaction fee for ETH decreased to $5.72 on the same day. These were the lowest levels seen since January 2021.
The lower transaction fees indicate a more efficient and user-friendly network experience for BTC and ETH users, as they can transact faster and cheaper on these networks. When transaction fees are lower for assets, it also means that the inflation rate for these assets is lower. This is because miners or validators create less new supply as a reward.
The lower transaction fees for ETH can be attributed to the implementation of an upgrade called EIP-1559. This upgrade has changed the fee market mechanism on Ethereum and was activated on April 14th, 2023, as part of the Berlin hard fork.
EIP-1559 introduces a base fee that is algorithmically adjusted according to the network demand and a tip that users can optionally pay to prioritize their transactions. The base fee is burned, meaning that it is removed from the circulating supply of ETH, creating deflationary pressure on the asset. The tip is paid to the validators, incentivizing them to secure the network. As per Glassnode's report, the implementation of EIP-1559 has resulted in the burning of over 1.8 million ETH, which accounts for approximately 1.5% of the total supply.
If you're a premium subscription member of the blog, you can join the special Discord.
Keep reading the article doesn't end here

Not a Premium member yet?
XRP's R
BTC miners’ inventory sale
The BTC miners’ inventory sale reflects the level of selling pressure and profit-taking behavior from the miners, who are the main producers and suppliers of new BTC.
As a miner, you need to balance your costs (electricity and hardware) with your earnings (block rewards and transaction fees). You also need to consider market conditions and prices when deciding whether to keep or sell your BTC.
Glassnode's data reveals that in June 2023, BTC miners transferred 2,617 BTC to exchanges, a significant increase compared to May 2023, when only 1,337 BTC were sent. This suggests that miners capitalized on BTC's impressive price surge in June, which saw a 13.6% MoM rise from $36,265 to $41,198. Presumably, the miners sold their BTC to cover expenses and secure profits, anticipating a higher difficulty adjustment in July following the recovery of hash rate after China's power outages.
The difficulty adjustment is a mechanism that ensures that the average time between blocks remains at 10 minutes, regardless of the changes in hash rate. Higher difficulty means that miners have to expend more computational power and resources to find new blocks and earn rewards.
According to Glassnode, the recent surge in BTC miners' inventory sales has caused a decrease in the net position change of miners. This metric, which measures the difference between miner outflows and inflows, turned negative in June 2023, hitting a low of -1,280 BTC on June 30th. This is the lowest level seen since March 2020 and indicates that miners are currently selling more BTC than they are generating or receiving. As a result, this trend could potentially have a bearish impact on the market.
Are BTC & ETH Overvalued? MVRV & SOPR
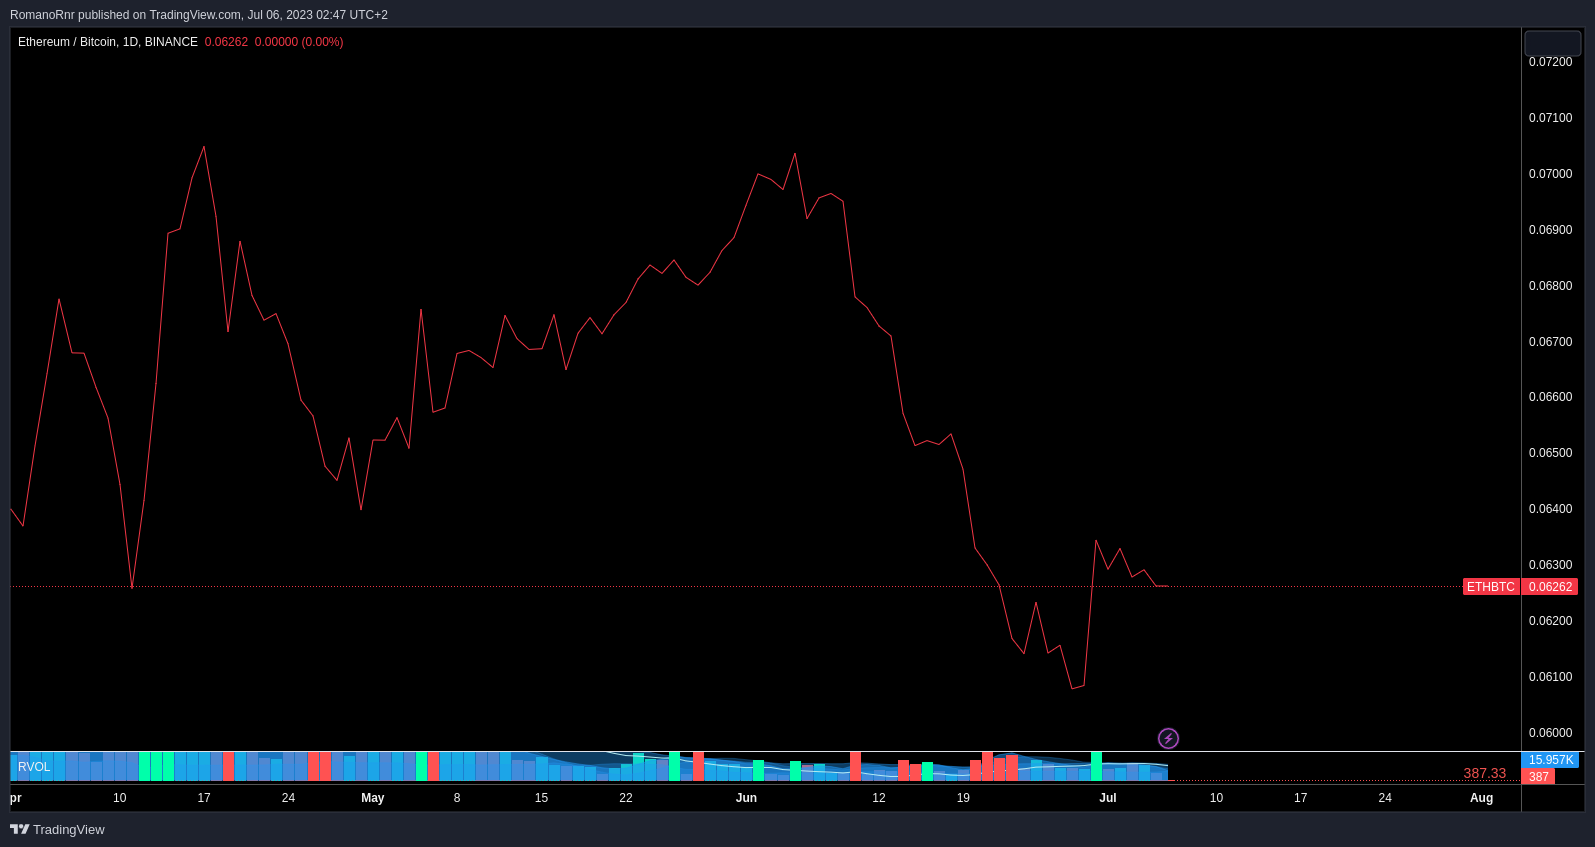
During the month of June, there was a significant improvement in the monthly price performance of BTC and ETH, with respective increases of 13.6% and 3.9%.
Bitcoin outperformed Ethereum, causing the ETH/BTC ratio to drop by 8.6%.
The MVRV ratios of Bitcoin and Ethereum increased, with Bitcoin's ratio rising by 12.8% to reach 1.50 and Ethereum's ratio going up by 4.0% to 1.45. However, the SOPR value for Bitcoin was not as remarkable as the previous month.
Now you may wonder what "MVRV" and "SOPR" value means. To quickly cover this.
The MVRV (Market Value to Realized Value) ratio for both cryptocurrencies has increased, suggesting a perceived higher value in the market compared to the value at which transactions were actually made.
MVRV stands for Market Value to Realized Value and is a way to identify whether Bitcoin price may be under or overvalued at any moment in time. When looking at the difference between Bitcoin market value and realized value, the extremes in the results have occurred at the major tops or bottoms of Bitcoin’s market cycles. - https://www.decentrader.com/charts/mvrv/
The SOPR (Spent Output Profit Ratio) for BTC has decreased, indicating fewer people are selling at profit compared to the previous month.
Spent Output Profit Ratio (SOPR) is a proxy visualization of profit-taking on the blockchain at any given moment in time. Let’s take a simple example. While not exclusively the case, when coins leave wallet A to go to wallet B, they are often being sold by the owner of wallet A to the owner of wallet B. SOPR shows whether coins moving between wallets are done so in aggregate profit, loss or breakeven during a specific time period. https://www.decentrader.com/charts/spent-output-profit-ratio-sopr/
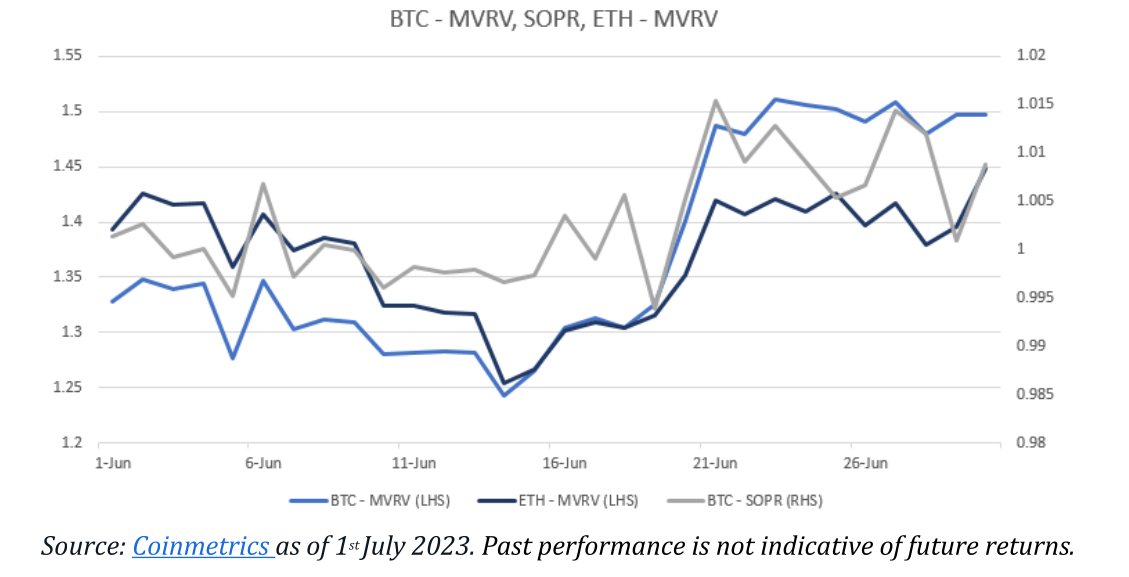
The MVRV (Market Value to Realized Value) ratio for both ETH and BTC has increased, suggesting a perceived higher value in the market compared to the value at which transactions were actually made. The SOPR (Spent Output Profit Ratio) for BTC has decreased, indicating fewer people are selling at profit compared to the previous month.
Bitcoin and Ethereum prices went up last month, which is good news. However, this doesn't mean it will always keep going up.
In relation to MVRV ratios, a high ratio indicates that BTC & ETH are priced higher than their actual value. This may suggest that they are overvalued and could lead to a correction. Moreover, the drop in the SOPR for BTC could mean that there is a reduced risk of significant sell-offs.
The MVRV ratio may suggest an overvaluation, which could worry some investors. Nevertheless, many investors may still perceive the possibility of substantial profits due to the cryptocurrency market's high volatility and speculative characteristics.
Realized volatility
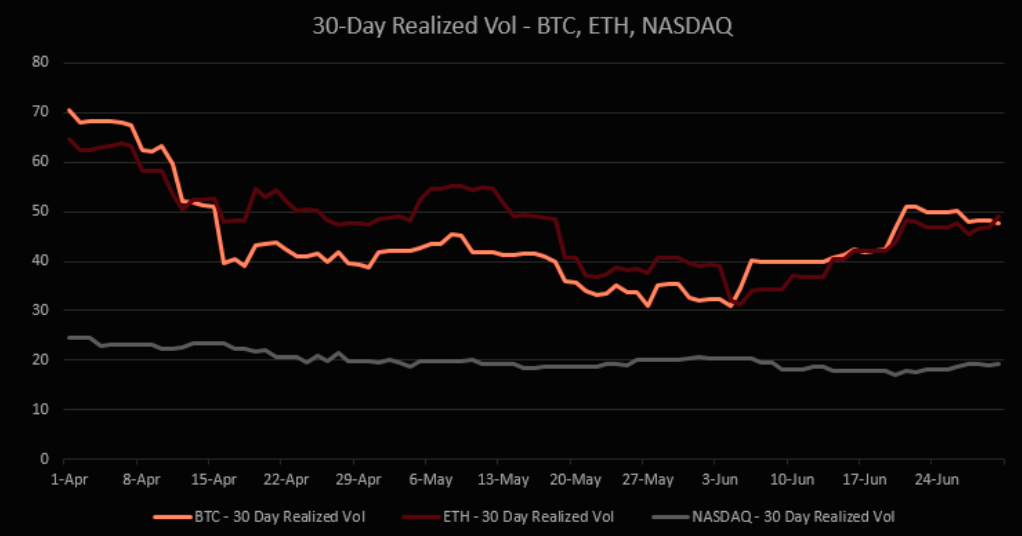
The increase in the 30-day volatility suggests a potentially riskier environment for short-term investments.
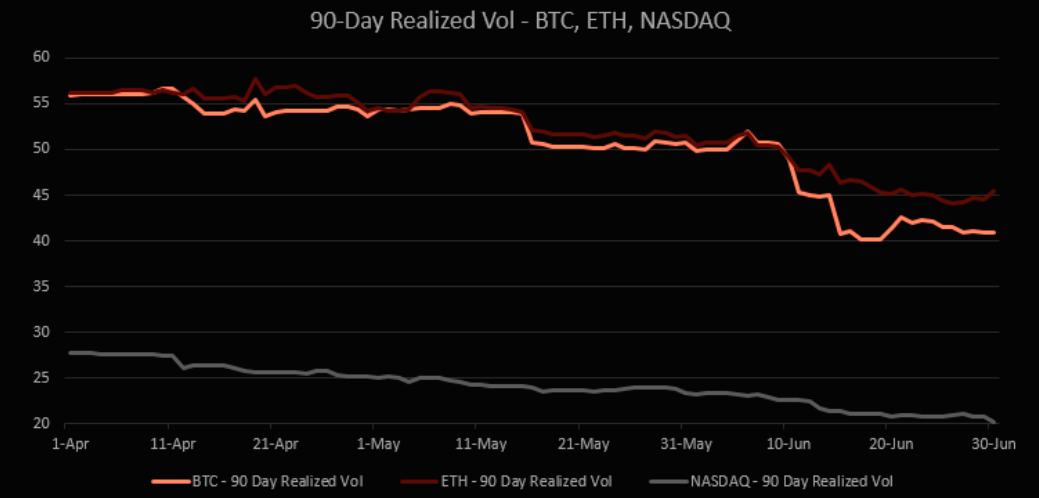
However, the 90-day realized volatility decrease implies a somewhat more stable and less risky outlook for long-term investments.
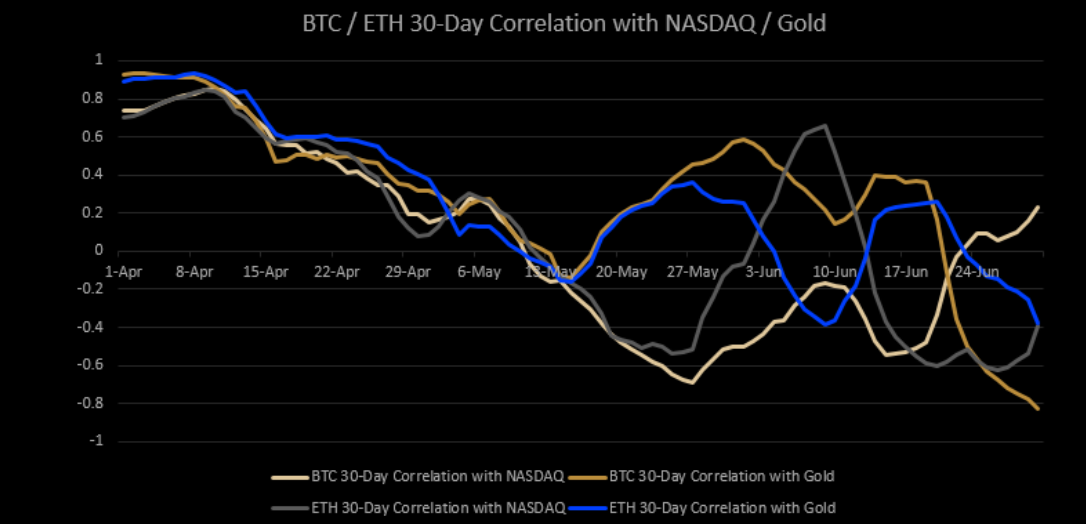
BTC/ETH 30-Day Correlation with Nasdaq/Gold
Before continuing to read, subscribe to the premium newsletter. The premium package also includes full access to my Discord.
The low price of $24.99 won't stay forever. It will be jacked up in the future.
Anyways you can continue to read further. The article does NOT stop here.
The Wealth Transfer
In June, there was an increase in new on-chain activities for both currencies, as evidenced by the increase in the daily average of new address counts. This means that more people have been entering the market, indicating a growing interest in cryptocurrencies. ETH has seen a more dramatic increase compared to BTC.
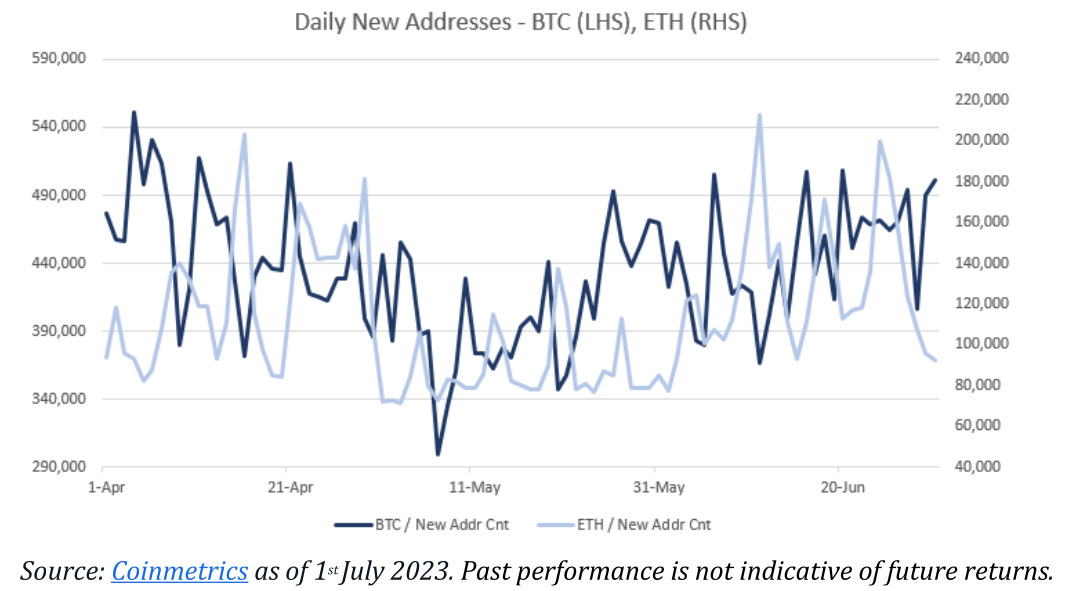
The May network congestion seems to have affected the numbers for ETH, as the June metrics resemble those of April more closely. This suggests that the increased activity in May might have caused some potential new users to delay their entrance until June.
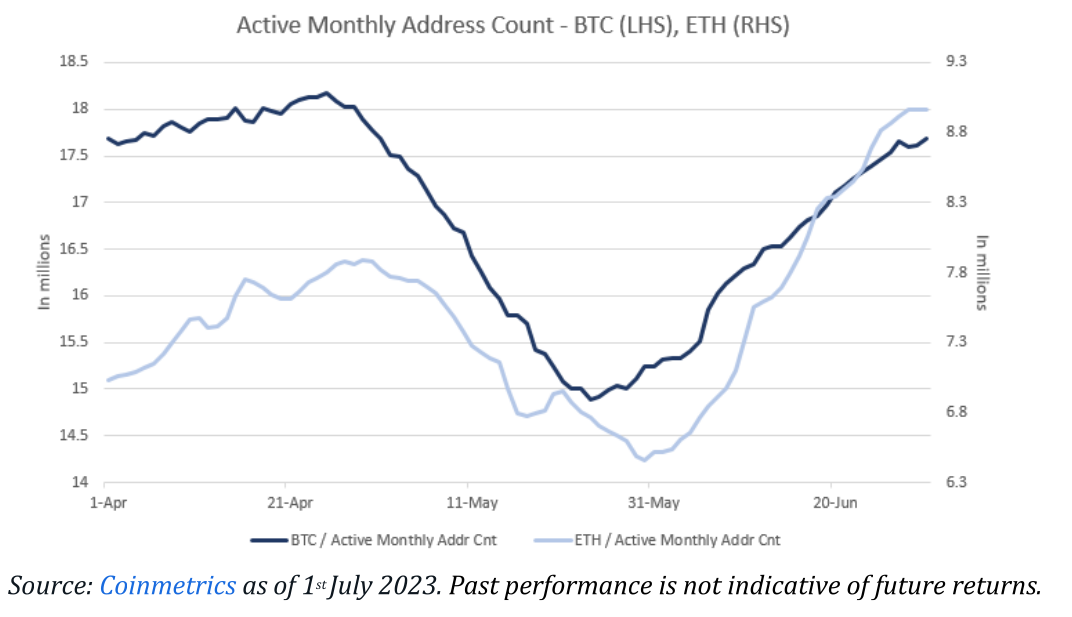
On a monthly basis, ETH outpaced BTC in address activity growth, suggesting a higher user engagement or transactions within the Ethereum network.
The increase in new addresses suggests more participants in the market, which can be seen as a positive signal for demand! However, one person can own multiple addresses, so it might not directly correlate with the number of new individual users. More addresses could be due to airdrop farming.
The growth of ETH addresses, in particular, could indicate a higher level of interest in decentralized applications (DApps), as Ethereum's platform is widely used for these applications. As for May, congestion could have been a temporary hindrance, and the rebound in June indicates resilience and continued interest in the network.
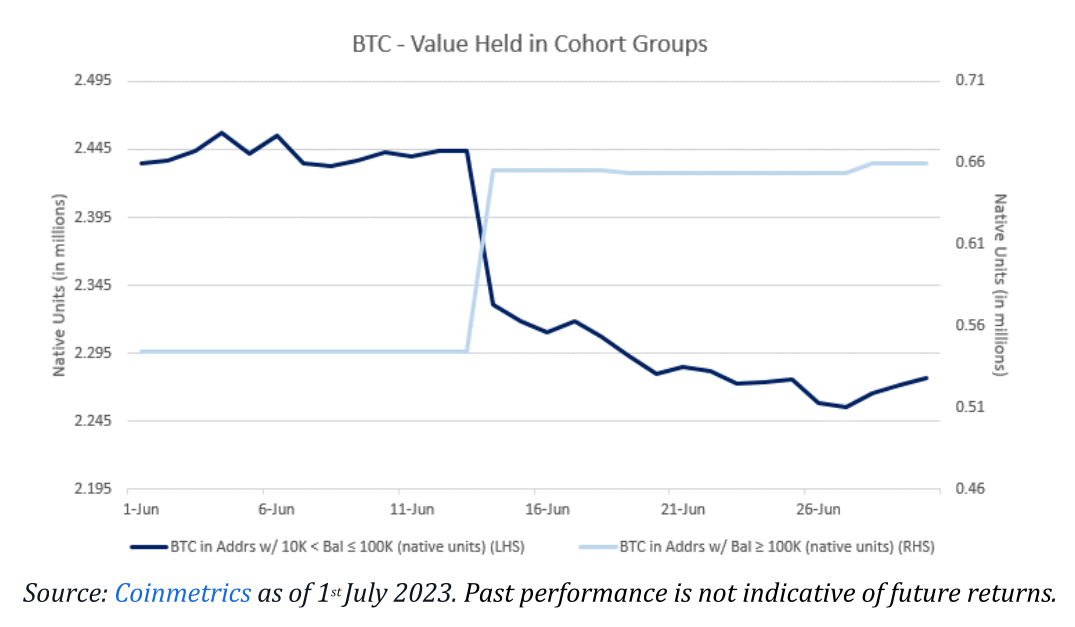
The fluctuations in the value of Bitcoin and Ethereum across various address groups can be observed through cohorts categorized by their cryptocurrency balance.
During the past month, there has been a significant change in the way wealth is distributed within Bitcoin and Ethereum.
For Bitcoin, addresses with balances between 10,000 and 100,000 BTC, which is the second-largest cohort, saw a decrease of 6.5% in their holdings. However, addresses with more than 100,000 BTC, the largest cohort, experienced a significant increase of 21.4% in their balances. This is an interesting reversal of last month's trend.
It appears that Ethereum has followed a comparable trend. The data shows that the number of addresses holding between 100,000 and 1,000,000 ETH decreased by 3.4%, whereas those with over 1,000,000 ETH saw an increase of 5.1%.
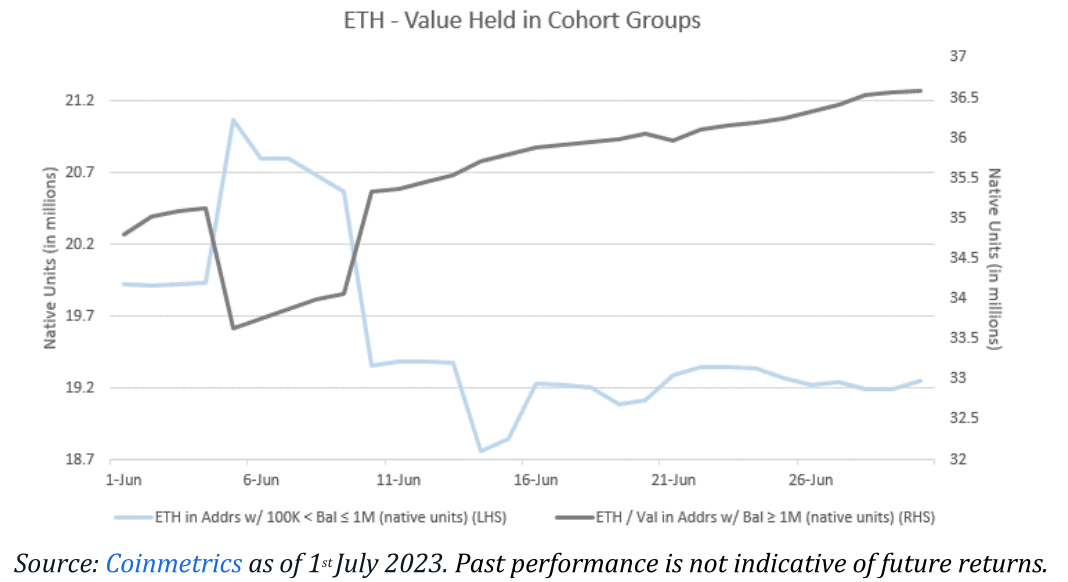
A possible wealth transfer from the second-largest to the largest cohorts for both Bitcoin and Ethereum.
It might also indicate that the largest holders (whales) are accumulating more of these cryptocurrencies, which could have significant implications on market dynamics and volatility.
But we should be careful since 'whales' could sway the market when they decide to sell, leading to increased volatility. This is a risk we need to consider.
The balances for BTC and ETH on certain exchanges have decreased by -4.0% and -5.8%, respectively.
[Please note, the full article is for premium newsletter subscribers only which also includes Discord access]
Mining Up: Hash Rate Up
The miner statistics indicate that the average mean hash rate for Bitcoin (BTC) experienced a rise in June, marking a 2.4% increase from the previous month. The hash rate is a measure of the computational power being dedicated to the Bitcoin network. When the hash rate is higher, it indicates that the network is more secure and there is an increase in miner activity.
BTC transfers from miners to exchanges have almost doubled from the previous month. This may mean miners are selling more Bitcoin rewards to cover costs or take advantage of good market prices.
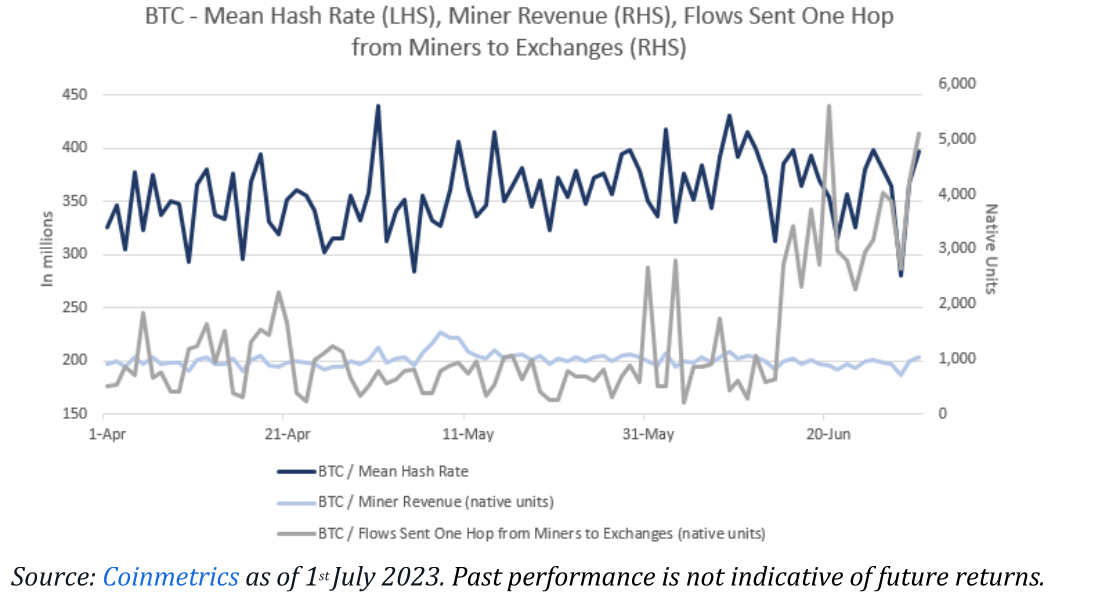
The graph above details includes the mean hash rate in terahashes per second (TH/s), the revenue earned by miners in BTC, and the volume of BTC sent one hop from miners to exchanges. A 'hop' refers to a transfer of BTC from one wallet (in this case, the miners' wallet) to another (the exchange's wallet).
A strong Bitcoin network may have a high hash rate, which shows that miners believe they will make money in the future.
On the other hand, the sharp increase in Bitcoin transfers from miners to exchanges could mean miners are selling more Bitcoin, possibly driven by favorable market conditions or a need to cover costs.
However, this increased supply could exert downward pressure on Bitcoin prices if demand does not match the pace.
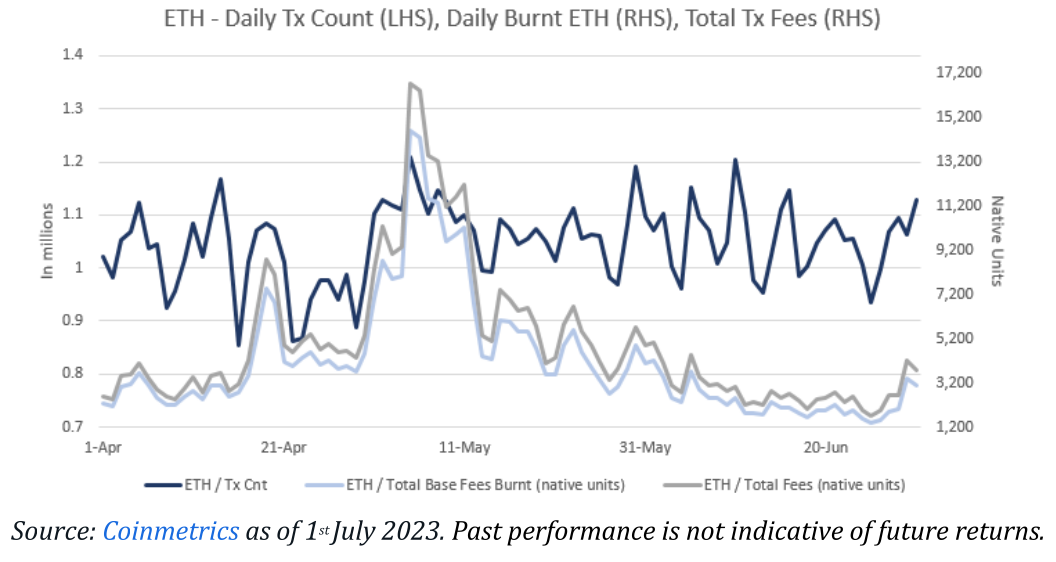
Ethereum On-Chain Activity Sees a Decline: Is This a Temporary Slowdown or the Beginning of a New Trend?
During the month of June, there was a noticeable decrease in on-chain activity for Ethereum in comparison to the network congestion observed in May.
On a month-on-month basis, there were decreases in key metrics, including the average daily transaction count, the daily amount of ETH burnt, and the total daily transaction fees.
There has been a decrease in the daily transaction count by 2.5%, a significant decline of 65.1% in daily ETH burnt, and a drop of 63.3% in the total daily transaction fees. The total daily transaction fees.

So the data highlights a decrease in Ethereum's on-chain activity in June compared to May. Specifically, the daily transaction count dropped by 2.5%, indicating a decrease in the overall number of transactions processed on the Ethereum blockchain.
The amount of ETH burnt per day has decreased by 65.1%, while the total transaction fees have also seen a decline of 63.3%. ETH burning is a process where a portion of the transaction fees gets destroyed or "burned" to reduce the supply of ETH.