Market view May 24, 2022
During the week of June 13-17, there are a substantial open interest in VIX (Volatility Index) options contracts that expire.
Federal Reserve will be meeting on June 15th, which could add to the volatility as traders try to protect their positions before the meeting.
There's a lot of potential for market movement during this week, and traders should be aware of it. The market may "chop" lower, but could rebound again as the market mean reverts.
There can be a lot of volatility in the market right now because there is a lot of uncertainty surrounding the upcoming expiration week and the Federal Reserve meeting.
Because the market is currently lower, that means that there are more puts outstanding that need to be cleared before expiration. So we could see a lot of volatility and movement in the market over the next few weeks as traders jockey for position.

The S&P500 may grind lower towards the $3700 (The same price during May OPEX), but with strong bounces along the way.
This is opposed to a major "limit down" market which coincides with new highs in the VIX.
A "limit down" market occurs when prices are falling so rapidly that the exchanges put in place temporary limits on how far prices can fall in a given day.
This usually happens when there is a lot of panic selling and market participants are worried about a further decline.
A break from its recent behavior would be a sign that investors are becoming even more worried about the market outlook. If there is no major deterioration in credit markets or geopolitical events, it is unlikely that the VIX will jump sharply higher. This is because those factors are typically what drives up the VIX.
There's still some time before the June OPEX options expirations, and the S&P500 struggle to break above the $4000.
$3500-3700 levels can be seen as support on the S&P500
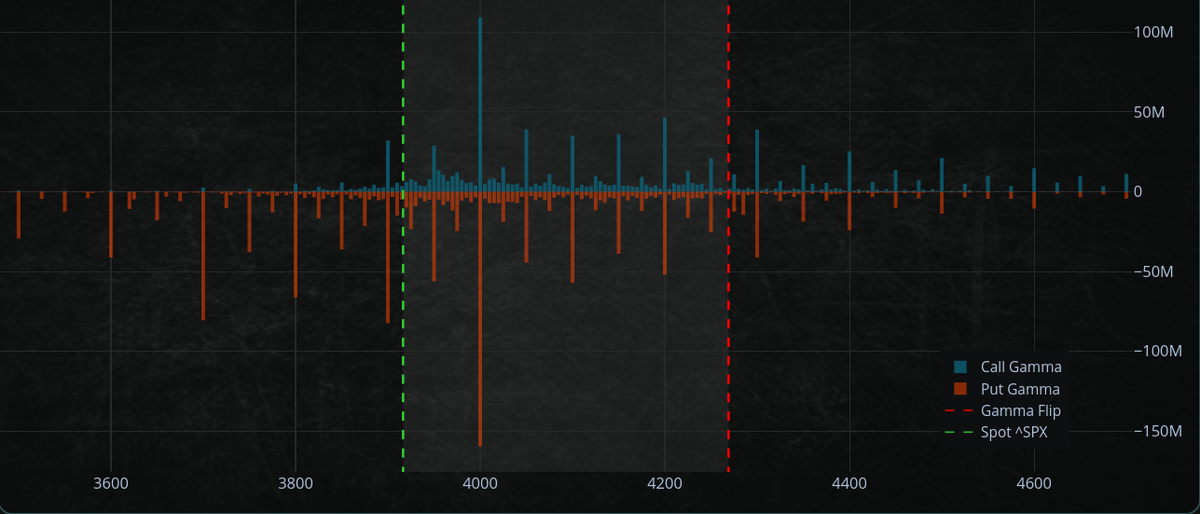
However, if the S&P500 breaks above 4,000, traders should be aware that there is a strong area of resistance at around 4,300, where negative gamma dealer flows are likely to reduce.

Negative gamma dealer flow?
Negative gamma dealer flows refer to the situation where the dealers who are selling options are losing money as the market moves against them.
This can happen as the market rallies and the dealers are forced to buy back their options at a higher price, or as the market falls and the dealers are forced to buy more options to offset their losses.
The implications of this are that if the SPX500 break out above $4000, there is a strong possibility that it will continue to rise, as the dealers will be forced to buy more options to cover their losses. However, if the market fails to break out and remains below 4,000, then the dealers will likely continue to sell options, which could keep the market range-bound.
If you want to learn more about options trading, I wrote a comprehensive guide/article
https://romanornr.medium.com/options-trading-fd4d0bffb2c5
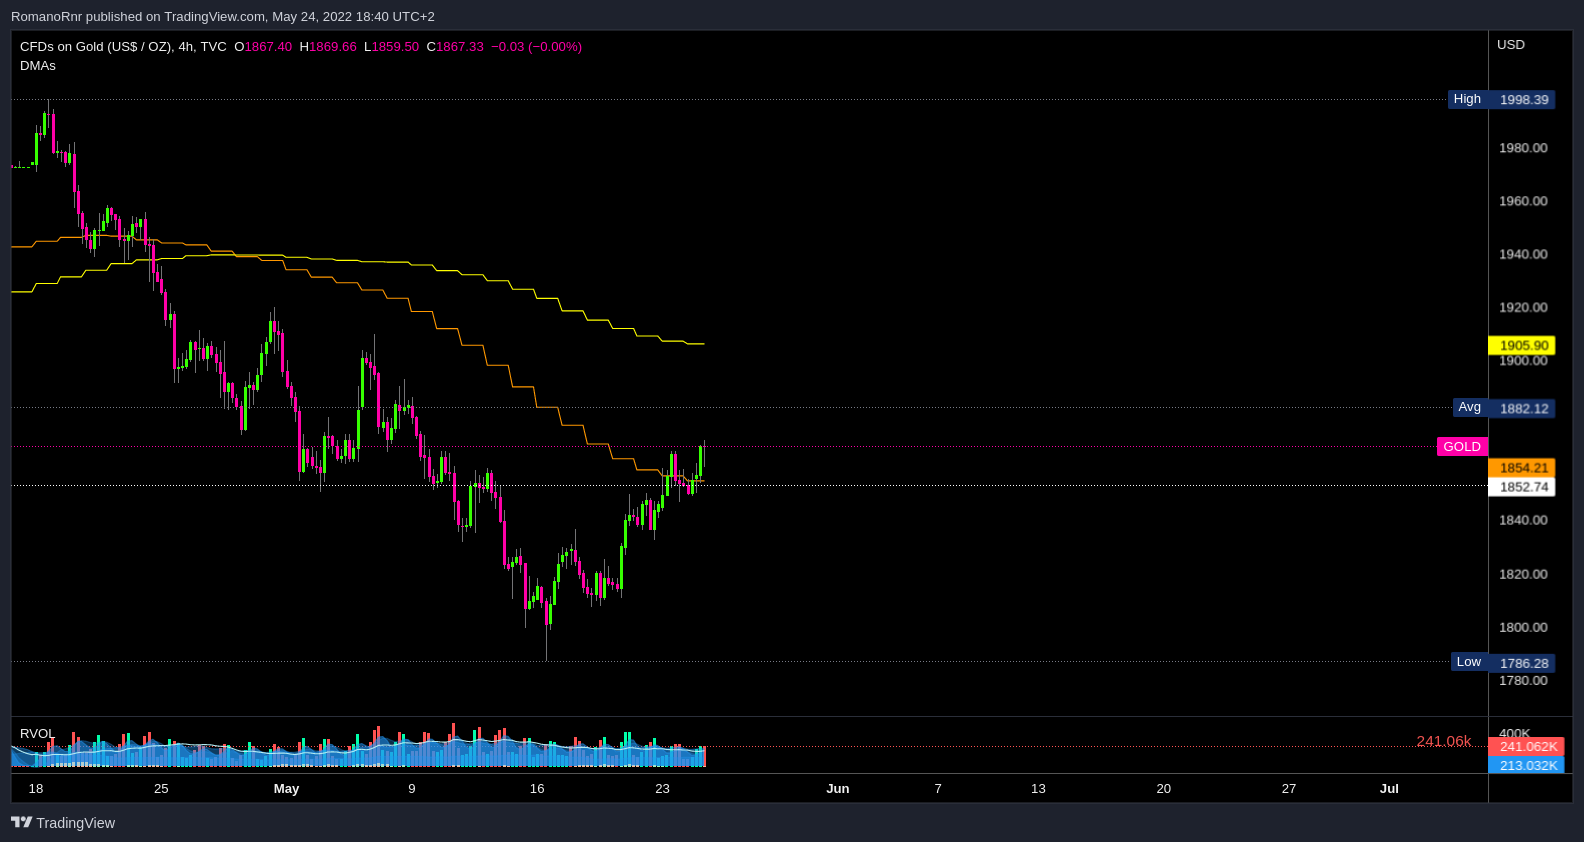
Gold
Gold prices have been rising steadily over the past week, and today they finally broke above the 20-day moving average.
The next level to watch is the 50-day moving average, which is currently around $1900. If prices manage to break above this level, it would be a very bullish sign.
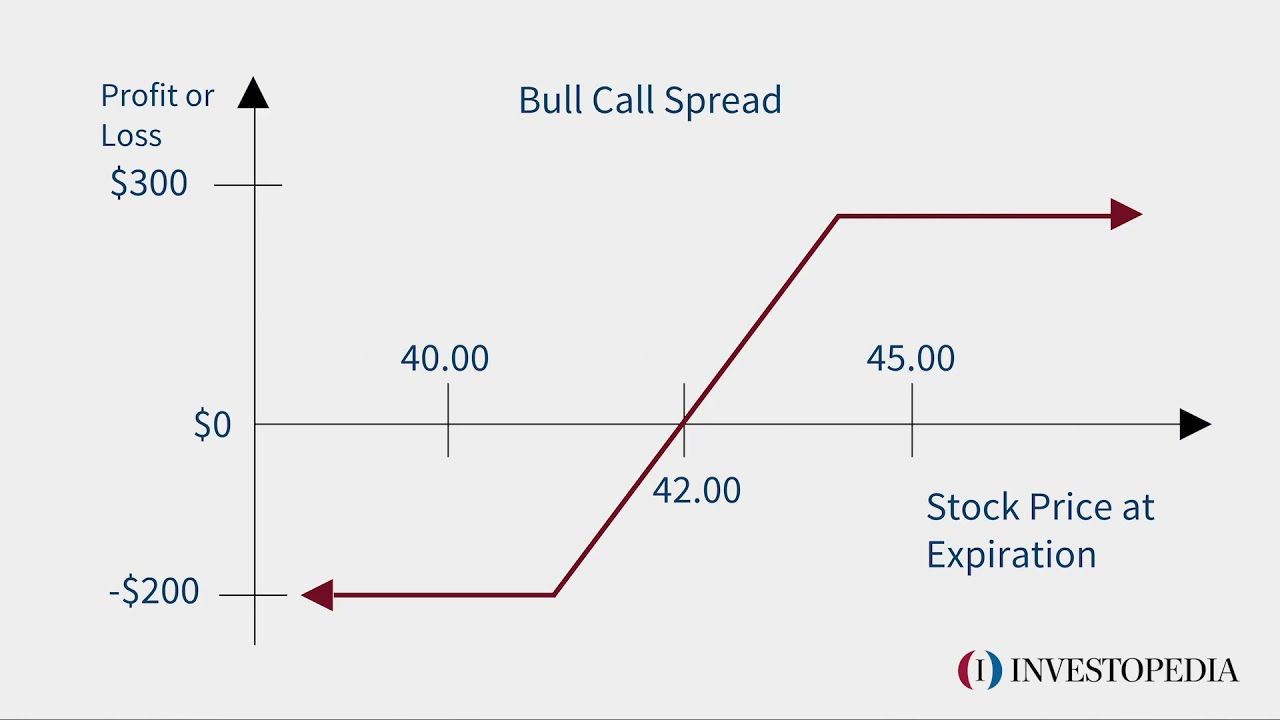
You can play an options trade "call spread"
example:
Buy a call option at the 1900 strike price
sell calls at the 2150 strike price.
This is a bullish trade that profits if gold prices rise above 1900. Prices have already risen above this level, so those who implemented this trade are already in the money.
Something like this