Market Research Jan 25- 2023

This morning at the time of writing, overall stock sentiment is negative due to a downbeat in the US session yesterday and Microsoft's weaker-than-expected sales report. The S&P500 and Nasdaq closed lower yesterday, and the negative sentiment got compounded by Microsoft's sales report.
Asia is mainly closed due to the Lunar New Year holiday, with open markets such as India, South Korea, Australia, and Japan all seeing some losses. European futures are forecasted to be down, and Nasdaq opened 51 basis points lower.
JP Morgan Trading Desk View on MSFT
Ted Spread
Last price: 0.1648
High on 09/30/09: 3.1481
Average: 0.4847
Low on 07/30/21: 0.0772
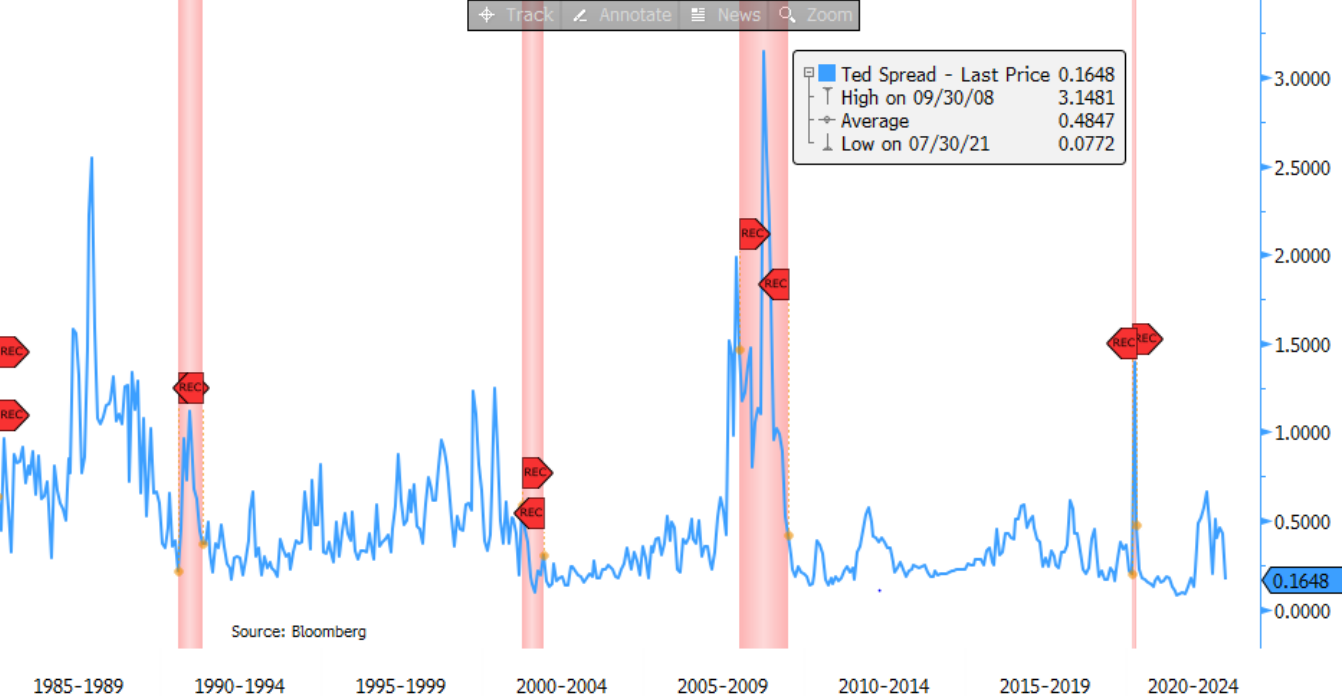
Ted Spread is the difference between the 3-month U.S. Treasury bill and the 3-month London Interbank Offered Rate (LIBOR) and is used to measure the credit risk of interbank borrowing.
It's calculated by subtracting the 3-month T-bill rate from the 3-month LIBOR rate, expressed in basis points.
- Regarding Microsoft (MSFT), the stock is trading down by 1% after the company's earnings call. Management lowered their guidance for their commercial business and margins, and their Azure FQ3 guide did not meet analysts' expectations.
- The CFO stated that while Azure exited FQ2 with mid-30s% cc growth, FQ3 will decelerate a further 4-5%pts (expected to be ~31% growth, instead of the 33% that was whispered). Commercial business, which grew 20% in FH1, is expected to decelerate from there - the previous guidance was for the business to grow 20% in the entire year. The CFO also softened their guidance for full-year double-digit growth, suggesting they must keep an eye on the PC and Windows markets.
- Finally, full-year OPMs are expected to decline by 100bps cc and 200bps reported - the previous guidance was for them to remain flat and at a decrease of 100bps, respectively. This cut reflects weakness in the OEM business.
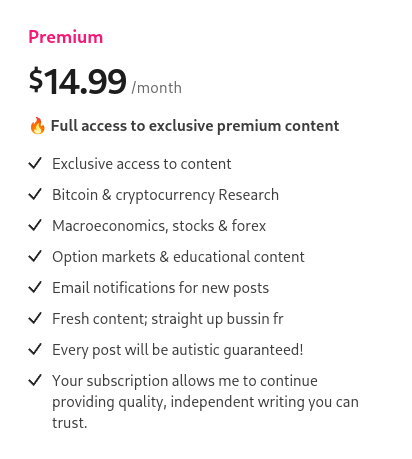
Premium subscription
Tired of seeing low-effort content on Twitter with random people posting lines on a chart?
Maybe subscribing to this newsletter is something for you to gain an edge over the market.
Read this content, and give your wife the impression that you actually know what you're reading instead of being a compulsive gambler using "Technical Analysis" (Astrology for men) only.
Also, read my free medium articles: https://medium.com/@romanornr/
Full access to exclusive premium content
Subscribe, and get a competitive edge over the market.
Take the first step to kick your wife's boyfriend out of the house & stop getting liquidated.
Optimism as a "Soft Landing" achievable?
Now the first month of 2023 is almost over, and we had a great start in the financial markets, actually, a fantastic start, as Goldman Sachs stated a couple of days ago.
This month's straightforward story of the macro environment has been reassuring for bulls across the markets. Both in the legacy markets and the crypto markets. It looks like the stars are aligned! Inflation is falling, and employment numbers look okay. Policymakers seem to have things under control.
We have seen some people declaring that the "soft landing" is real, inflation was transitory after all, the pain was just for one year, and the fear of a recession or depression was overblown. It seems like we got injected with 5ml of hopium.

Reality check, taking a closer look at "recover"
Although some may be hasty in drawing judgments, dunking on "bears" for missing the bottom, the facts are still available.
Even with indications of improvement, it seems like we collectively have the memory of a goldfish. It seems like we forgot we are still in the aftermath of the epidemic, and complicated geopolitics and the full extent of its effect have yet to be seen.
We must maintain some skepticism and reasonable expectations, especially concerning the core PCE (Personal Consumption Expenditures), which may have trouble meeting the 2% target.
Even while things may appear good on the surface, we need to take a step back and try to confront reality.
Since the start of this year, the old diversified 60/40 portfolio strategy (60% equities, 40% bonds) has been working again. According to market data, it has been the most profitable strategy this year again since 1987.
However, continue with caution. Maybe a "set and forget" overleveraged long and "long your longs" might be a bad idea as you might corner yourself into a risky position. As GS suggests, try to keep taking profits by selling your bags into strength if the S&P500 reaches around $4000 - $4300
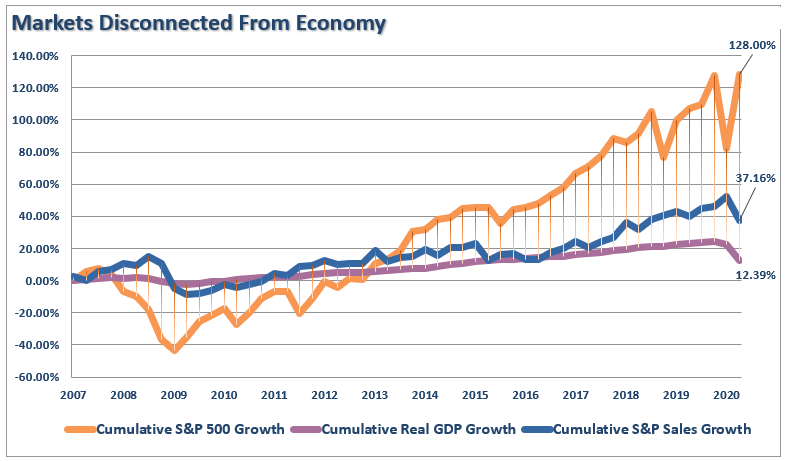
A sane person doesn’t want to pay an 18 P/E multiple for 0% expected earnings growth.
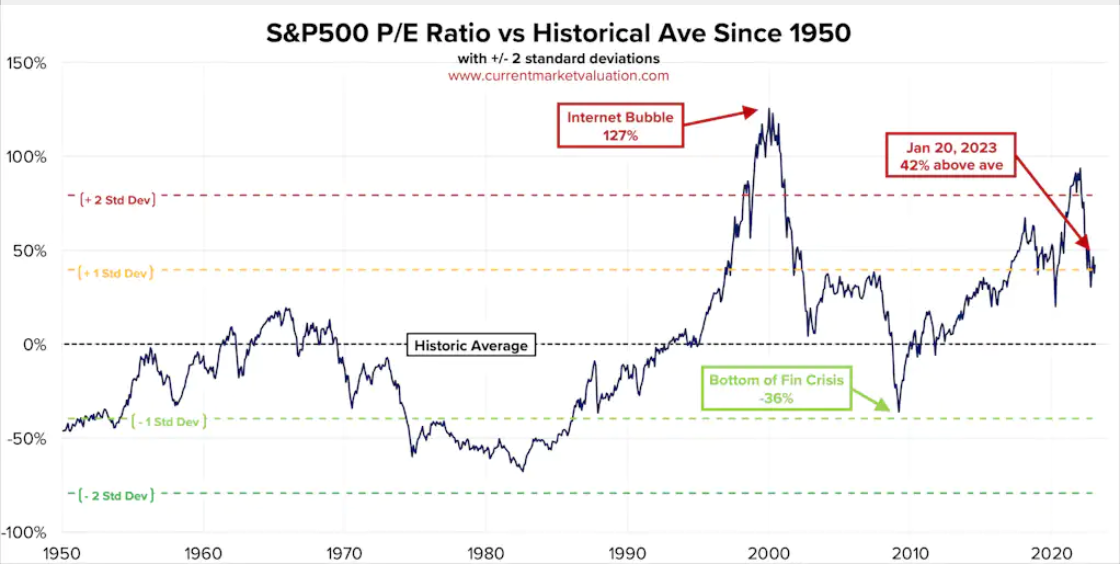
The price-to-earnings (P/E) ratio is an important metric to consider when evaluating investments. This ratio measures the price of a company relative to its Earnings Per Share (EPS). Essentially, it indicates how much an investor is willing to pay for each dollar of a company's earnings.
A high P/E ratio can be seen as a sign that the stock is overvalued, while a low P/E ratio may indicate a potential bargain.
In this case, a sane person would not want to pay an 18 times price to earnings (P/E) multiple for a company whose expected earnings growth is close to 0%.
The lack of expected earnings growth makes it unlikely that a stock will go up in price in the future.
On the other hand, perhaps a bit more lucrative, non-US markets look more profitable, a great place to allocate some profits into those markets.
Sell assets that have gained strength in the U.S. equities market, such as stocks with high returns over a certain period of time. Instead of focusing solely on U.S. equities, the analyst should diversify and consider investing in other markets.
That might provide a greater return potential while still mitigating risk. Finally, keep the overall risk of their portfolio tight by ensuring that they have a balanced portfolio with relatively low-risk assets. Maintaining a well-balanced portfolio can minimize the risk of incurring losses.
There is no way to eliminate risk, move it to other areas or alter its shape and timing.
Risk is the possibility that a specific outcome will not be achieved. Risk cannot be eliminated altogether, but it can be spread out over time, shifted from one person to another, or redistributed in form.
When a company takes on debt, the risk is shifted to the lenders, who are now at risk of being unable to get back their money.
Similarly, when companies invest in stocks, the risk shifts from the company to its shareholders.
In insurance, the risk of a mishap is shifted from one person to another. The person taking on the risk can be compensated for the potential losses that might happen. In any of these cases, the risk is merely being moved or redistributed over time in a different shape rather than eliminated altogether.
Is the Softlanding a hoax?
“Will the Federal Reserve be successful in achieving another soft landing?” is the question everyone has been thinking of.
Is the Federal Reserve capable of keeping inflation under control and the economy from collapsing simultaneously without leaning too much in either direction?
When the central bank raises interest rates to prevent the economy from overheating and rising inflation, the objective is to achieve a "soft landing" and avoid the pain of a sharp drop in economic activity.
We might get some insights by analyzing past successes and failures of the Federal Reserve and its attempts at a "soft landing."
Alan Greenspan's tenure as a Fed Chair is widely credited as having engineered a successful "soft landing" in 1994-1995. In addition, the Fed also engineered 2 other "soft landings" in 1984 and 2018.
We can see how likely we will have a soft landing now. What we do with the information provided here will go a long way toward determining whether or not the Federal Reserve can resume its "soft landing" policy.
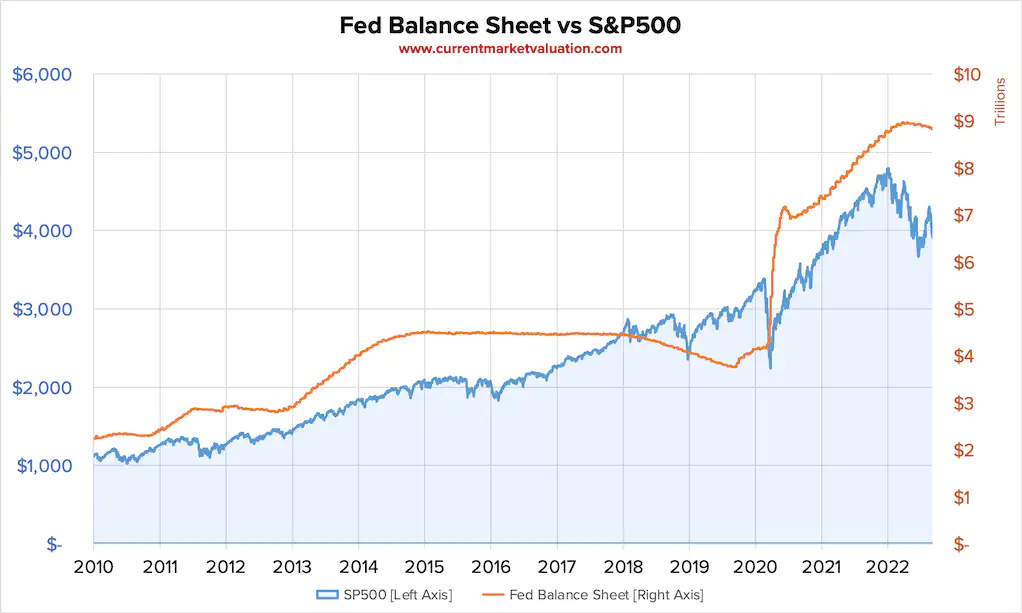
The graph below depicts the Fed rate-hiking cycle with orange shading indicating soft landings.
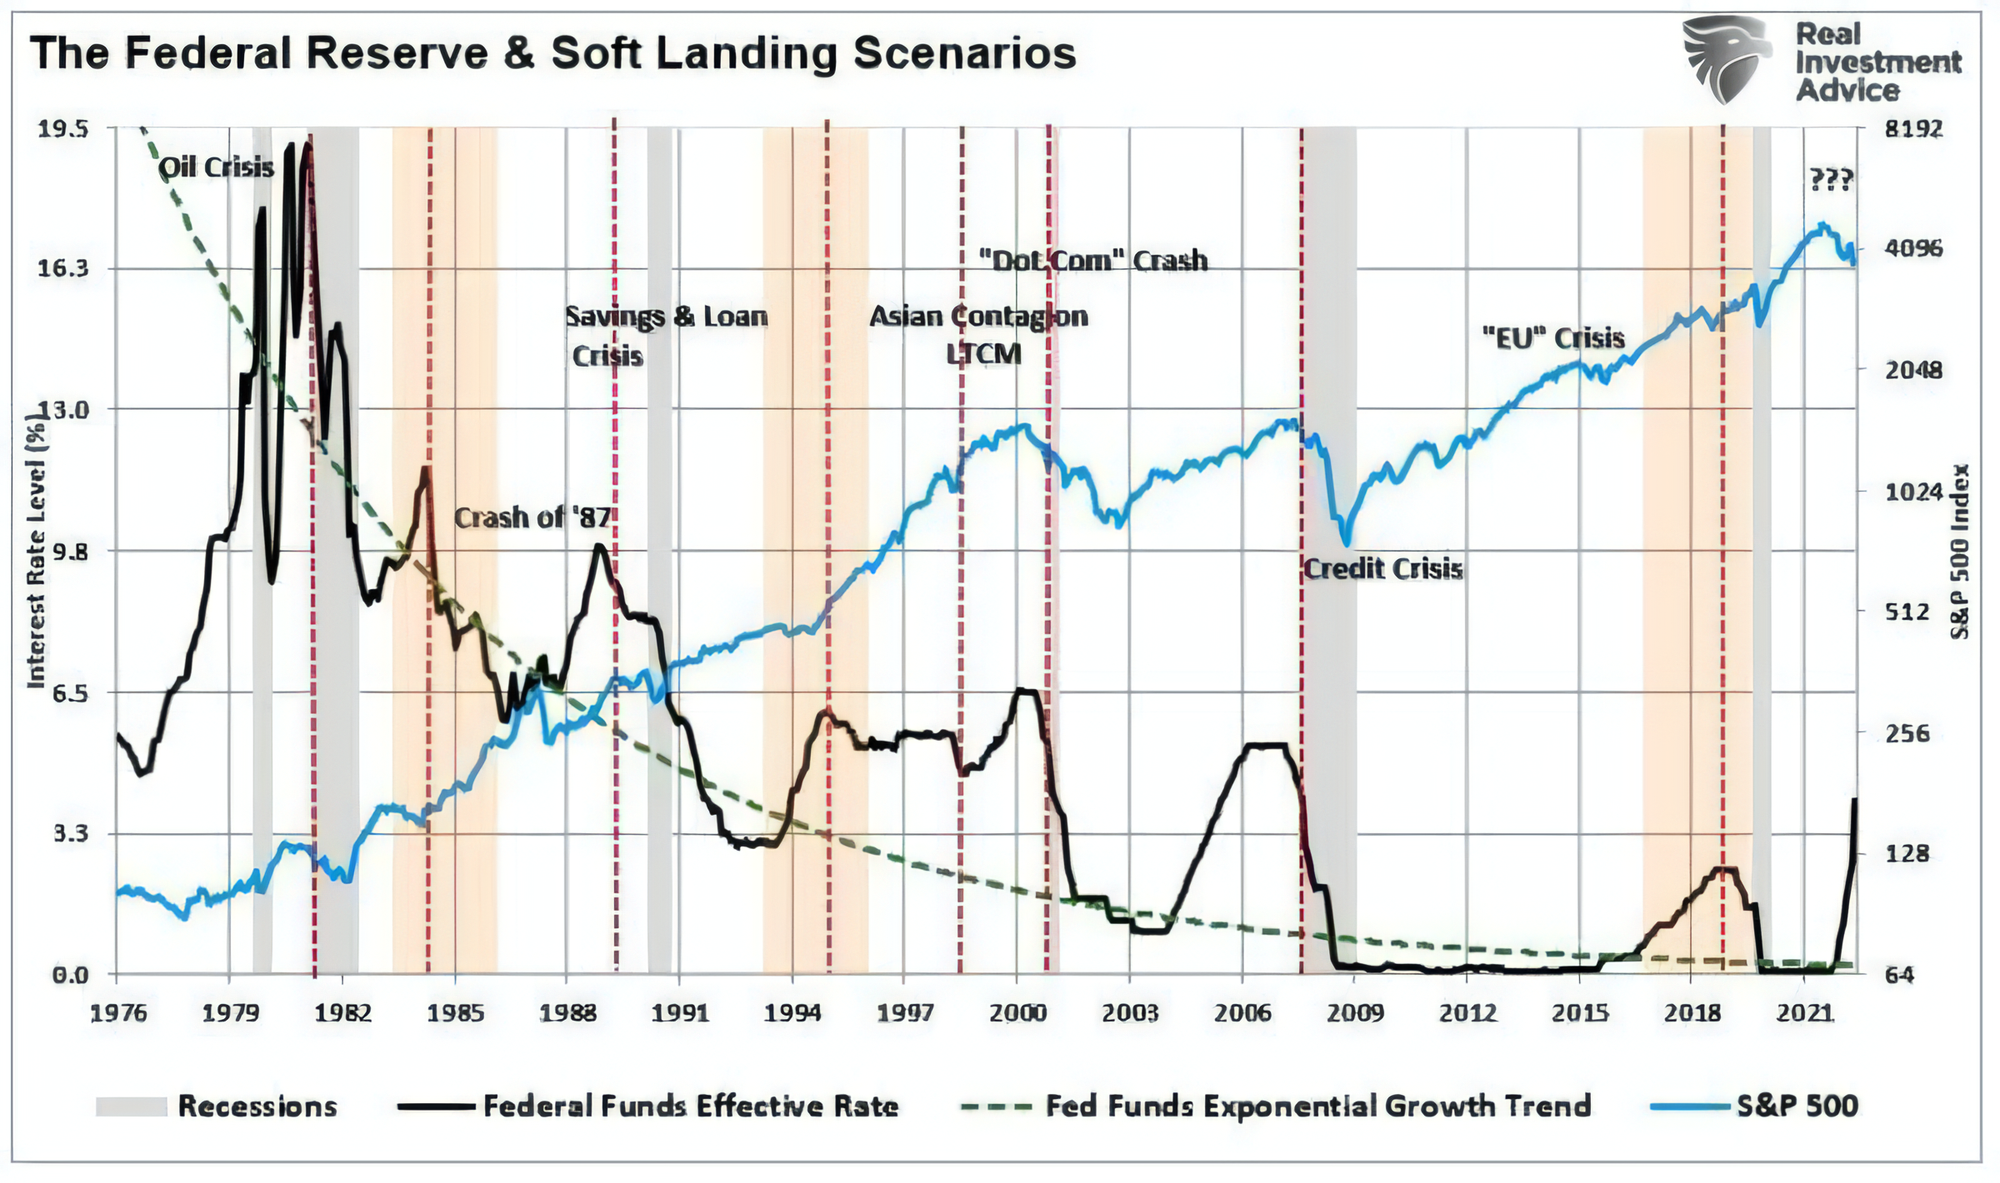
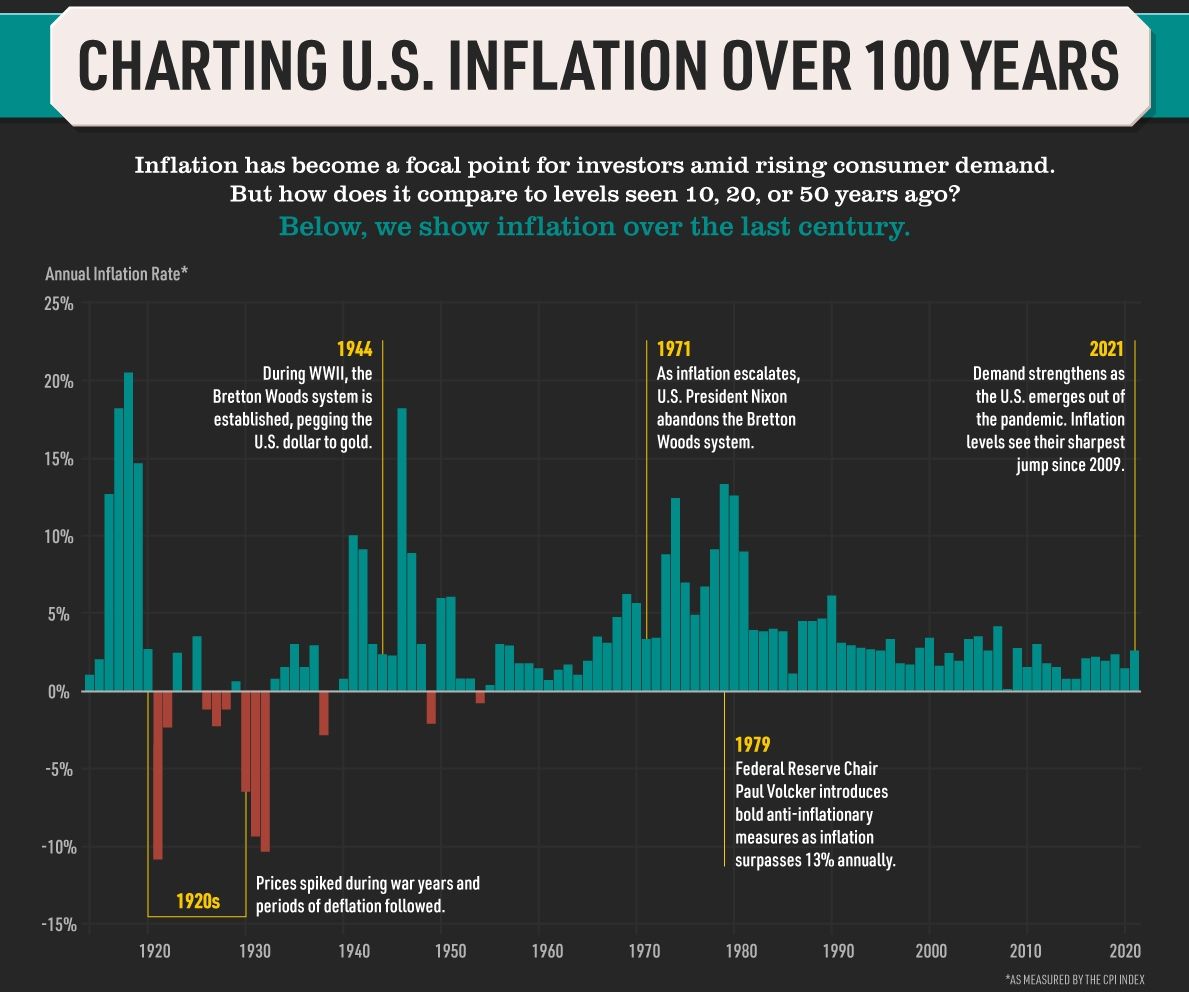
Once upon a time, inflation had reached unprecedented heights, climbing past 5% for several years. However, after each peak, a recession or “hard landing” followed close behind.
In the past, this pattern of high inflation followed by a recession occurred in 1948, 1951, 1970, 1974, 1980, 1990, and 2008. Here we are again in 2023, with inflation higher than ever.
Unless drastic action is taken, yet another recession appears to be on the horizon. Will there be a soft landing this time, or will we, too, experience a recession? So yet, no one has figured out the solution to that mystery.
The Federal Reserve has been just like a roller coaster ride ever since it took a firm grip on the financial markets in the late 70s under chairman Paul Volcker.
While the intention has always been to create a smooth ride, gentle enough that the economy would arrive safely at its destination, there have been bumps along the way, with the occasional crisis event. Even though there have been a few "soft landings," they were anything but "no recession."
It's like getting up on that roller coaster, fastening your seatbelt, and getting ready for a smooth ride.
You think you'll be able to take a few deep breaths and feel the nerves slowly settling in the pit of your stomach.
But then, the roller coaster suddenly dips, jerks, and veers off in an unexpected direction. The unexpected twists and turns make you grip your seat to ensure you don't fall off.
When the Federal Reserve hikes its interest rates, it's like getting on a roller coaster—you never know when the crisis events will arrive.
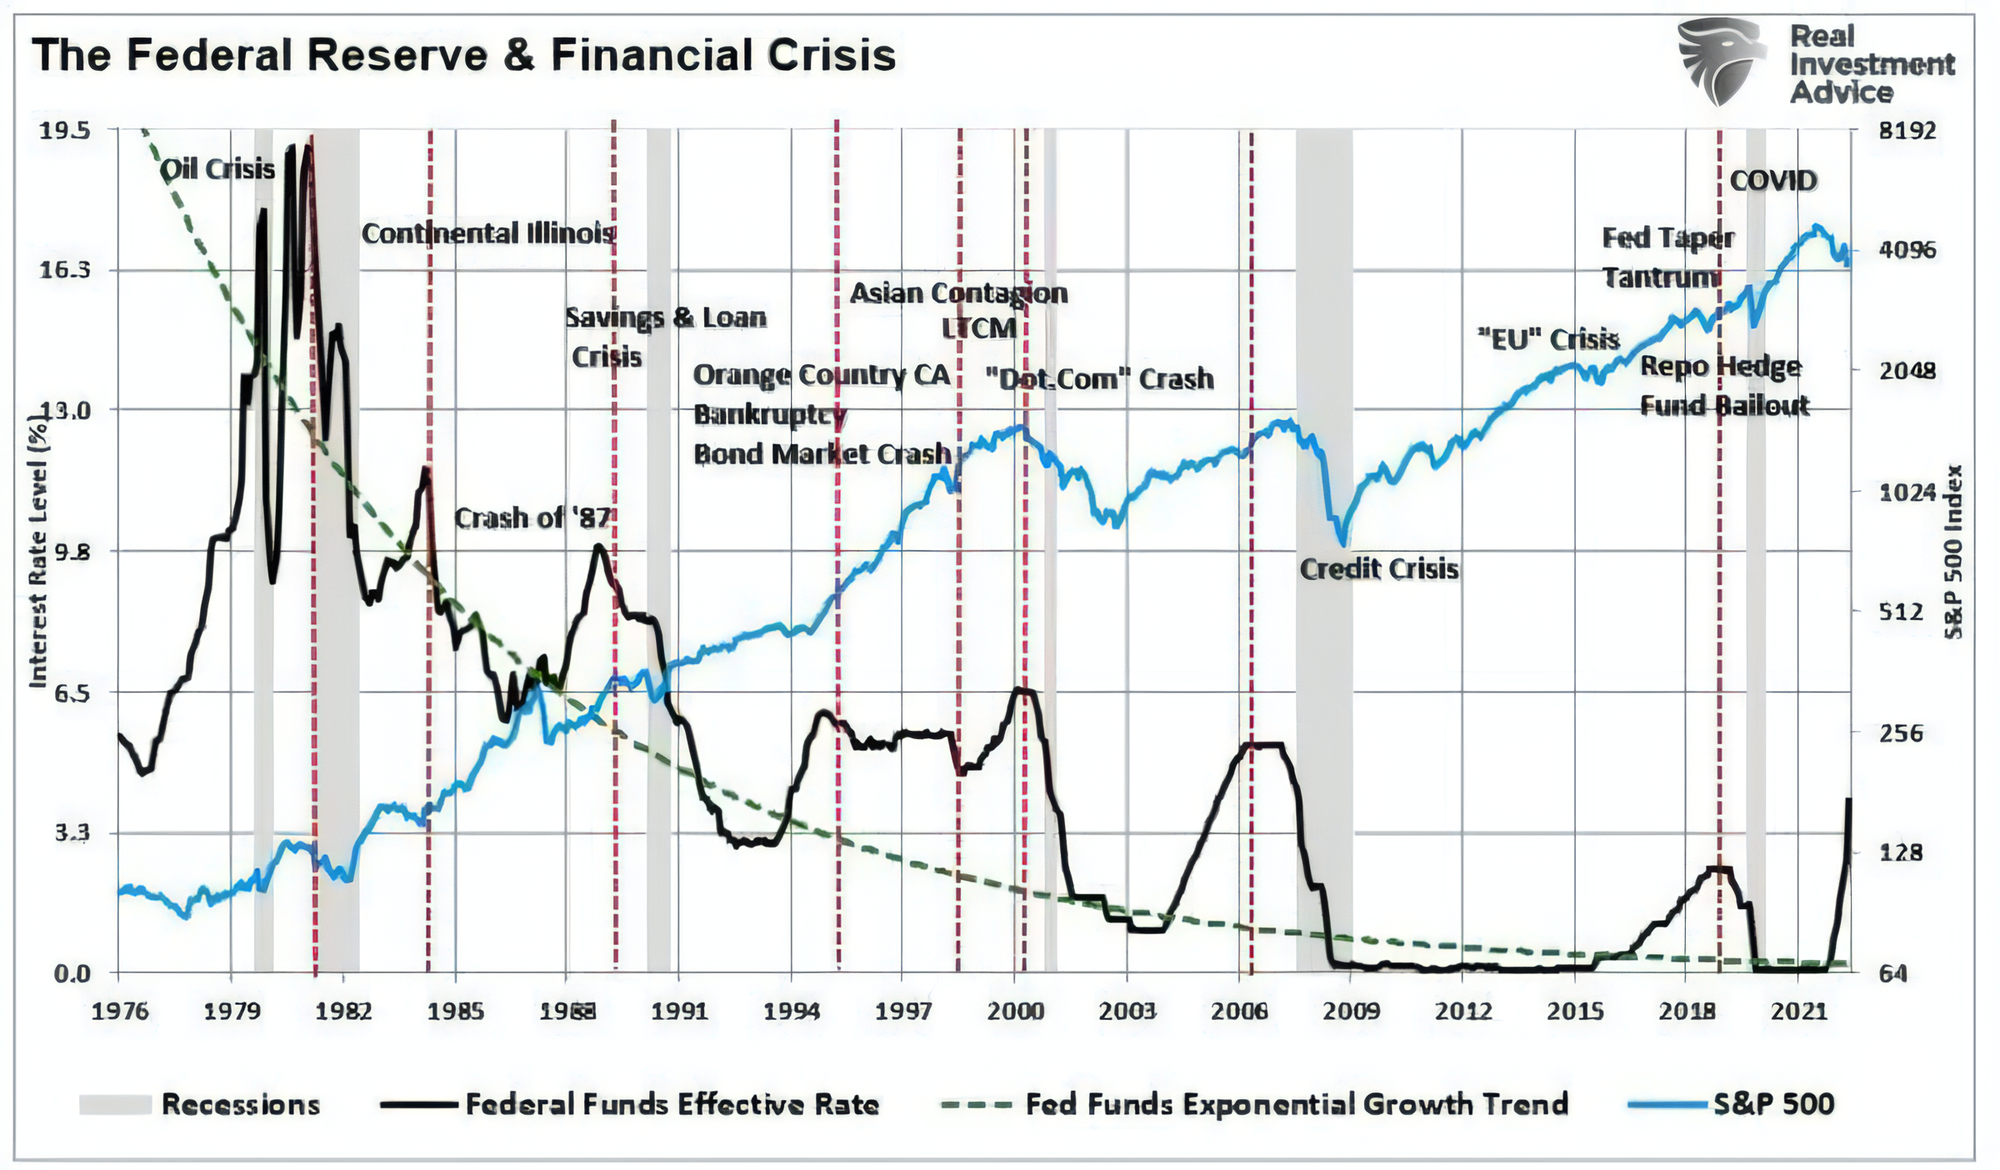
The term "too big to fail" was coined after Continental Illinois National Bank and Trust Company, the largest bank in U.S. history, failed in 1984 and was rescued due to its size. The Fed's rate hikes caused debt defaults and the bank's failure.
The Great Bond Massacre of 1994, a global bond market crash caused by a rise in rates and the rapid spread of bond market volatility, further highlighted the need for large banks to be treated differently.
Remember the good days the economy was booming, and the Federal Reserve was sure to keep things in check by gradually raising interest rates to protect the financial system? The yield curve had inverted, and the economy was nearing a recession. Even though the rate hikes didn't yet cause significant damage, the strain of the hikes was starting to show.
Then the pandemic hit, and it seemed like the rate hikes had almost made the situation worse by setting off a chain reaction of market downturns leading to a recession.
Now the Federal Reserve is trying to course-correct, but the "lag effect" of hiking rates brought us a breaking point, and it's a lesson. As with most things in life, it's not always clear what the consequences of your actions are until after the fact. The consequences of our actions aren't always clear right away, and sometimes the implications won't appear on the surface until it's too late.
The Federal Reserve has the power to shape the fate of the nation. Despite their best efforts and aggressive rate-hiking campaign, they don't appear to be sure if the economy will hold up.
During the pandemic in 2020, the Fed sent a massive amount of stimulus directly to households, hoping it would create artificial demand in retail sales. What seemed to be working, as the immense influx of liquidity created a surge in people's savings.
However, like all good things, it must come to an end.
Eventually, this surge would have to revert to the previous growth trend, which is a disinflationary risk. The "lag effect" between the reversion of savings and economic growth was critical to the outcome of the Fed's monetary policy.
So, as the Fed aggressively started to hike rates in 2022, that monetary influx slowly started to revert back. The Fed knew or should know this could result in inflation falling rapidly over the next 12 months, and an economic downturn could be a huge risk. It's not a question of
"Will the Fed break something?" instead, we should ask ourselves, "What will they break this time?"

At the Fed, a race against time was unfolding. The economy was slowing, and Chairman Powell committed to combat inflationary pressures.
As inflation rose, Powell knew that interest rates could not remain at “zero bounds” when a recession began. The Fed was in a rush to hike rates before the economy hit a soft landing. This should concern us about the lag effect of monetary policy changes.
Demand was dropping, resulting in an imbalance in the supply chain. Powell knew that time was of the essence and had to act prudently. He probably didn't think a soft landing was certain, but he aimed to have interest rates as high as possible before the economy faltered.

He hoped it would spark activity but was also aware of the risks ahead. The Fed’s only fundamental tool to combat an economic recession is cutting interest rates. However, the lag effect eventually catches up with the Fed, and an economic pivot will be necessary.
When this lag effect catches up with the Federal Reserve, a policy pivot may not be as optimistic as many investors believe.
Options trading ahead of earnings
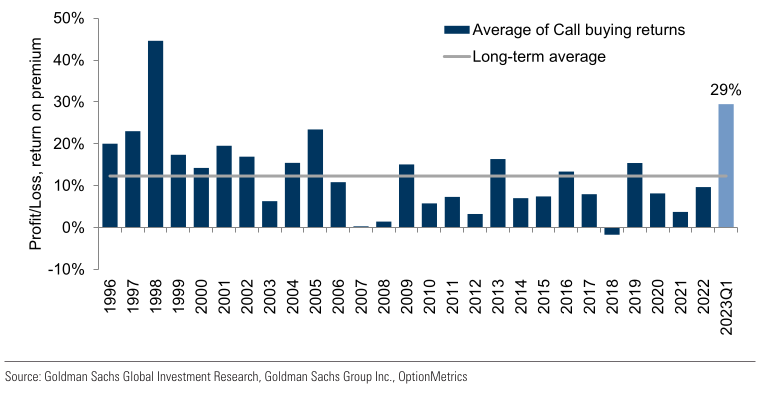
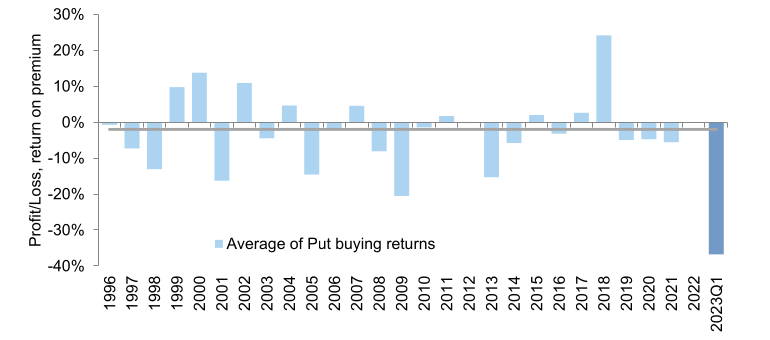
We are looking at the data from stock options trading in the S&P 500 for this quarter and have observed that buying calls ahead of earnings season has yielded a positive return of 29%, according to Goldman.
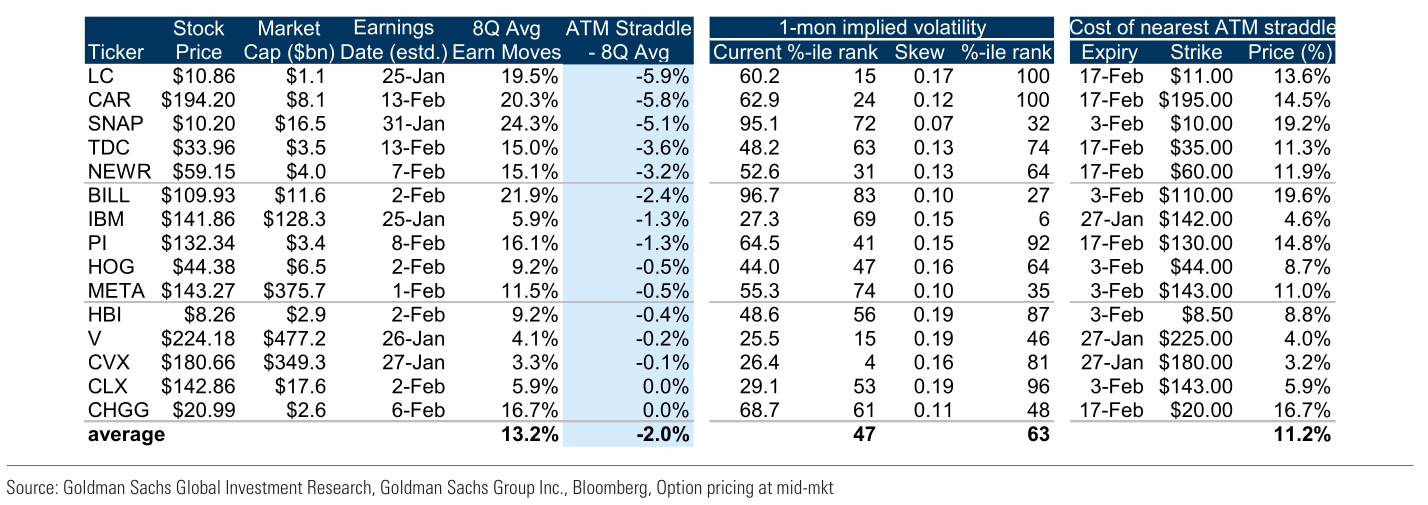
59 of the S&P 500 stocks have reported earnings, and the one-month implied volatility for the average S&P500 stock has dropped by 4 points since the start of the year to 30, which is in the 24th percentile when compared to the data from the past year.
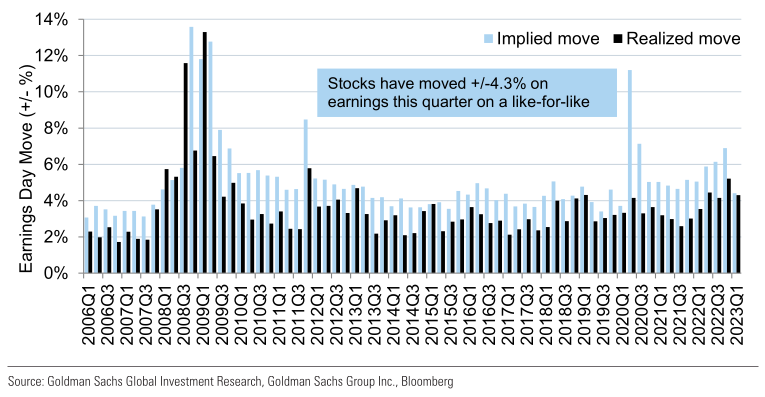
The one-month normalized put-call skew is in the 35th percentile relative to the past year, suggesting that investors remain bullish before the upcoming earnings weeks. Options imply an earnings-day move of +/-4.5% for the average S&P500 stock yet to report earnings, which is lower than the historical average implied move of +/-5.2%.
Therefore, it is recommended to strategically buy straddles on stocks where option prices appear to be below their historical 8Q earnings-day moves. Examples of large-cap companies on this list include SNAP, IBM, and META.
If you have no idea about how options trading works, read my free 8-article series, which I have written on medium: https://romanornr.medium.com/list/options-trading-fce6d05f0412
Click to collapse trade ideas.
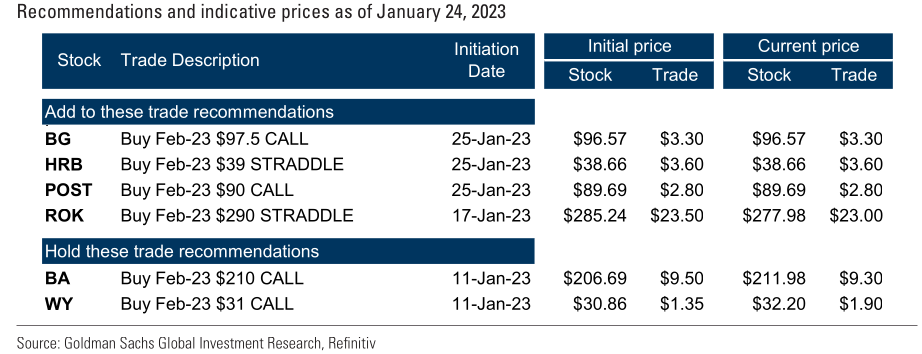
Trade idea 1: Buy POST call earnings:
Analyst Jason English from Goldman Sachs expects POST's earnings to see an inflection in 2023 due to a better supply chain and improved Consumer Brands. He believes the company has already worked through the worst of the multi-year supply chain challenges, with its Food-service business now generating EBITDA above pre-COVID levels, even excluding transitory benefits. Furthermore, POST's US Consumer Brands have returned to margin expansion this year and now have enough inventory in their Refrigerated Retail segment. Overall, the fundamentals look strong, despite the bottom-tier valuation.
Given this, POST options appear attractive ahead of earnings. The options market implies a move of +/- 3% is only in line with its 8Q earnings-move average, while its two-week implied volatility of 28 is in its 32nd percentile compared to the past year.
Furthermore, POST stock has underperformed the S&P 500 by 7% in the last month. Therefore, Jason English recommends buying POST Feb-23 $90 calls, which were recently offered at $2.80 (3.1%), with the stock at $89.69. Call buyers risk losing the premium paid if the stock closes below the strike price on expiration.
Buy HRB straddles ahead of earnings.
Goldman Sachs Info & Business Services analyst George Tong believes that competitive pressures and margin compression lead to a potential valuation correction for H&R Block (HRB). They expect to see a resumption of secular headwinds associated with the shift from assisted DIY tax prep in the 2023 tax season. They also expect HRB to lose market share in the assisted category. Additionally, they anticipate a negative impact on the company’s effective pricing, or net average charge, due to the complexity associated with cryptocurrency, retail trading, and Child Tax Credits. They expect this to lead to a decrease in EBITDA margins from the high-20s to the mid-20s.
Given these pessimistic predictions for HRB, Goldman Sachs recommends buying the HRB Feb-23 $39 straddles. This is a trading strategy where an individual buys both a call option and a put option, both with the same strike price and expiration date. The call option gives the buyer the right to buy the underlying asset at the strike price on the expiration date, while the put option gives the buyer the right to sell the underlying at the strike price on the expiration date. The straddles are offered at $3.60 (9.3%), with the stock at $38.66. This suggests that traders believe that the stock may move up or down at least 8% around earnings. The one-month implied volatility is below levels seen around earnings over the past year, and the one-month normalized put-call skew is at median levels relative to the past year, indicating that option prices are low and market positioning is balanced ahead of earnings.
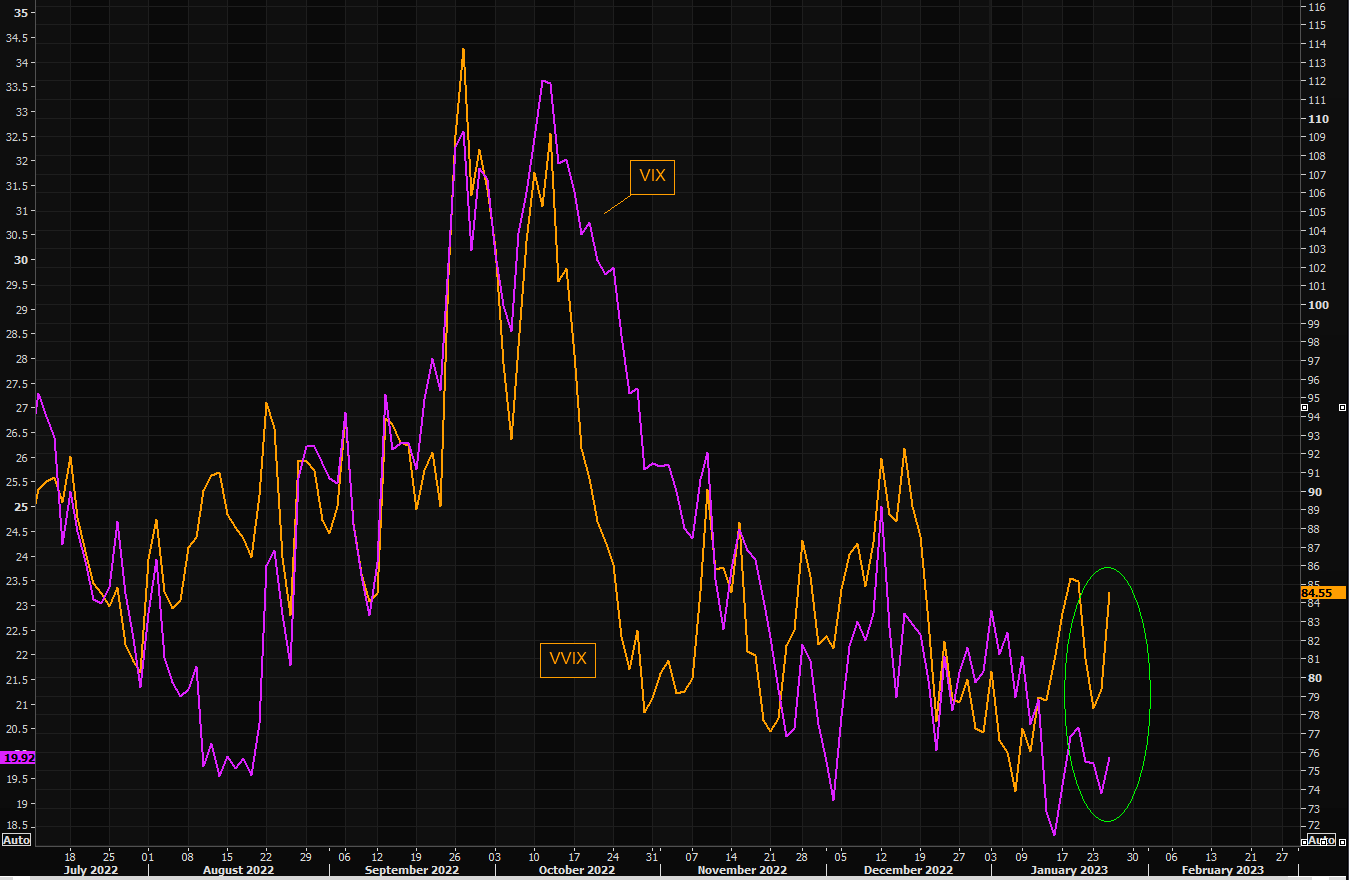
VIX & VVIX
VVIX measures the premium between VIX futures contracts with different expiration dates. I see VVIX as an indication of the perceived “fear” in the market, as it tracks the premium paid for near-term VIX futures relative to the longer-term VIX futures.
Recently, VVIX has moved higher since early January and has left VIX behind. This may indicate that investors are increasingly worried about near-term volatility and fear a large market move. Perhaps it's a more efficient way to manage near-term volatility, so market participants are willing to pay more for VIX futures contracts that expire soon.
It remains to be seen how the volatility marketplace develops from here. Knowing and understanding the VVIX to get an edge over market fears and gauge the level of near-term volatility in the markets.
As they say, buy insurance when you can, not when your house is already on fire.
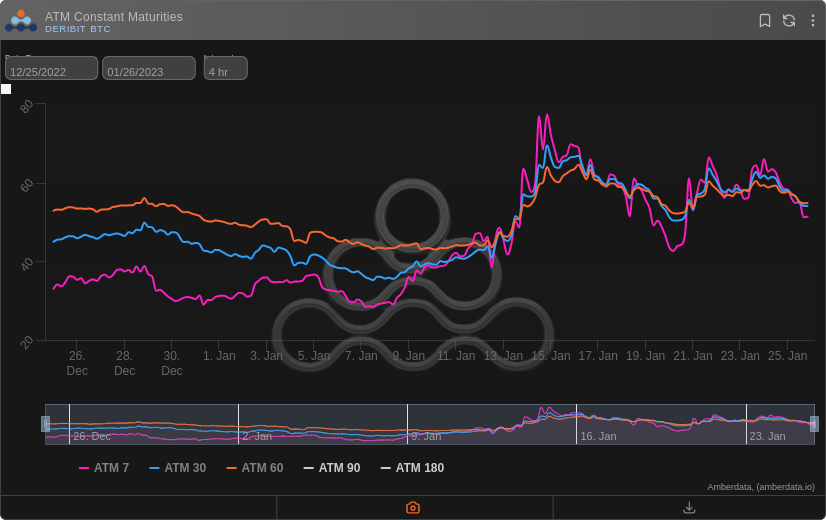
Bitcoin volatility
Bitcoin's value can sometimes become very unstable, meaning it can experience significant changes over short periods of time. This is known as Bitcoin volatility. In the past, Bitcoin has had a higher degree of volatility, with large movements in its price. Recently, however, Bitcoin's volatility has been decreasing, with the asset exhibiting less extreme swings in its price.
The chart looking at 1-week, 1, and 2-month volatilities refers to the change in Bitcoin's volatility over different periods.
The chart shows that Bitcoin's volatility has gradually decreased recently and that the differences between the 1-week, 1-month, and 2-month volatilities have become smaller.
Bitcoin FOMO is fading
The Skew Constant Maturity 25 delta C-P came down recently
This measure is an option pricing model used to value options, measure implied volatility at the 25 delta call, and put options with 7-day maturities.
Remember, the delta of an option is the rate of change of the price of the option with respect to movements in the underlying spot price, so the 25 delta option is sensitive to price movements in the underlying. C-P stands for call and put options, and the model measures the cost of the option relative to the difference between the call and put prices.
The Skew Constant Maturity 25 delta C-P measure came down, and Fomo for the upside is slowing down. Decrease in the Skew from 13 vol points (a measure of the difference between the implied volatility of puts and calls) to 3 vol points over a 10-day period for ATM-7.
That momentum and gamma losing momentum. Many market participants are bullish, and they may be absolutely right (or not) to be bullish. We know how it works. You know how it works—first, they long with leverage. Keep adding longs. Their profits go up exponentially. They trade themselves into a corner, and a small dip or sideways gets them liquidated, even though it may have been a blip of the charts when zooming out one day.
Blockwallet
I've been recommending Blockwallet in several tweets.
I made the switch from Metamask to Blockwallet.
The user interface and functions are much better; it works better with my Trezor and switching between accounts. Extra privacy, flash bot protection & anti-phishing. You can also import your Metamask seed, etc.
However, I've seen one of their latest tweets, BlockWallet has a token called "BLANK"
Kicking off the new year with some heat - the $BLANK token burn 🔥 pic.twitter.com/rm83xOo0wt
— BlockWallet 🔲 (@GetBlockWallet) January 16, 2023
If I were a betting man, which I am. I will assume that Blockwallet users are eligible for a nice airdrop. I would recommend installing Blockwallet and making some transactions.
You can export your Metamask seed and import it into Blockwallet. There's no need to reshuffle your assets etc., as some people think. Some people don't want to make the switch because Blockwallet has no mobile app right now. It doesn't matter. You can install Metamask or 1inch wallet on your phone and import your seed on your mobile wallet, which is not Blockwallet.

Chrome extension link: https://chrome.google.com/webstore/detail/blockwallet/bopcbmipnjdcdfflfgjdgdjejmgpoaab
Gtrade
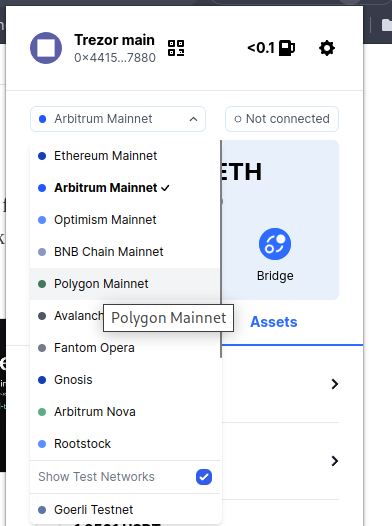
I've noticed this interesting DEX. So gTrade has a really nice UI but also has forex and stocks. I am still playing with the DEX. I recommend using the Polygon network to trade on the.
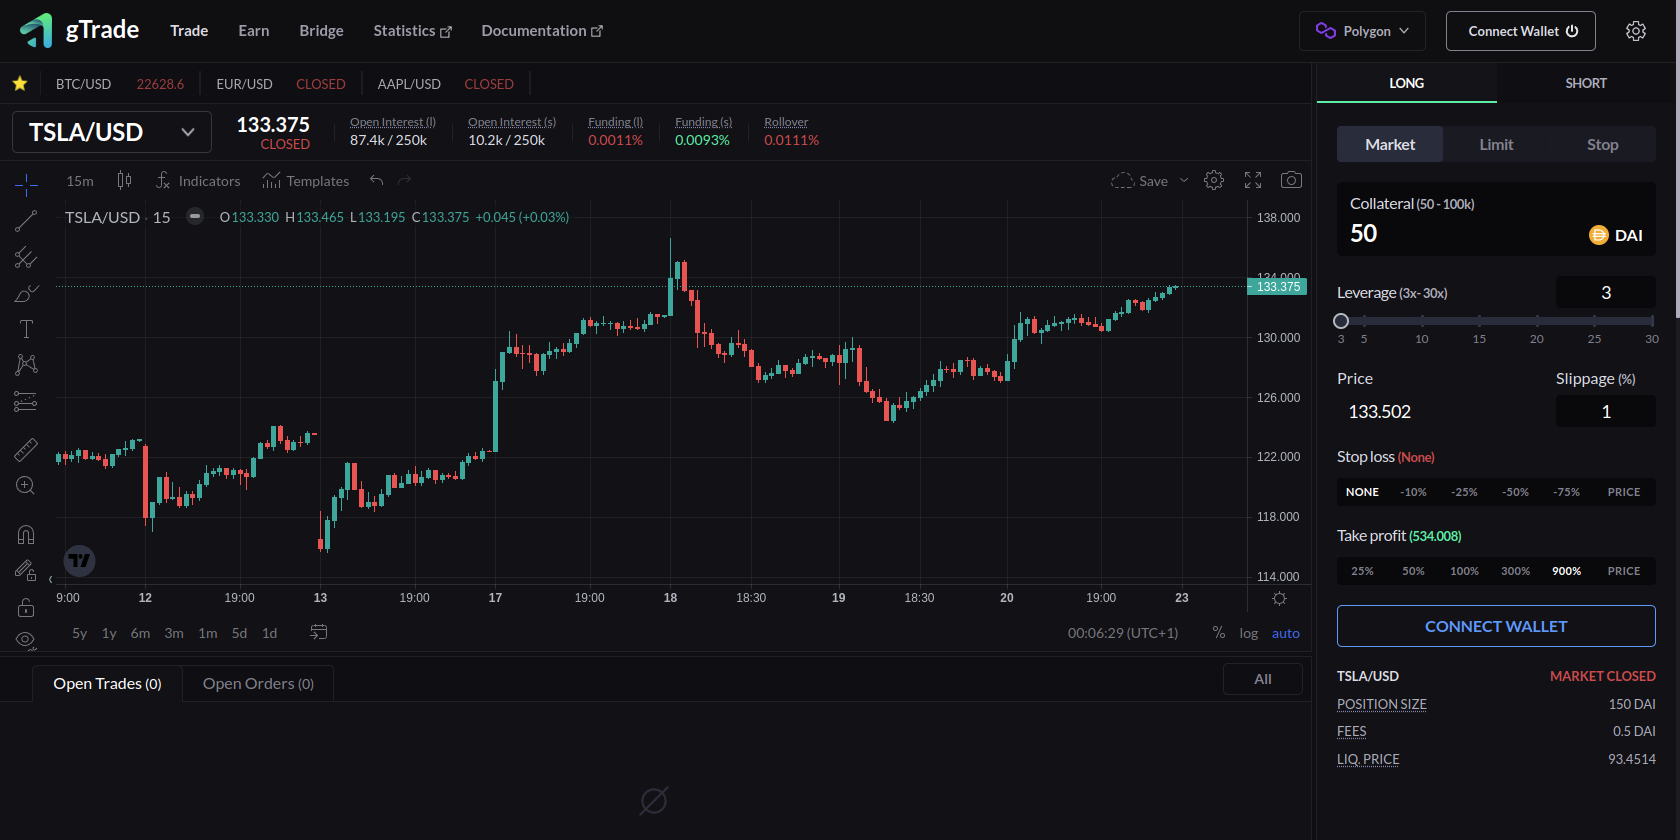
Again, switching from network and bridging is easy with blockwallet
Apex Dex by ByBit
Reminder Apex incentive program, which pays you to trade and keep tour trade open, is ongoing.
They pay rewards to keep that position open lmao
— Romano (@RNR_0) January 12, 2023
Grand idea (however, maybe it won't work)
Use 1 wallet to long x amount
Use 1 wallet to short same amount
Farm rewards neutral?
Discount ref link code: https://t.co/JsJlHH5k3s
Ref code = 46
disclaimer: I hold 1 ApeX OG NFT pic.twitter.com/SgtbrREWS6
Think I can close it for a moment now
— Romano (@RNR_0) January 16, 2023
I like trading on Apex. I get rewards in BANA tokens as a reward
Basically, 1/3 position size as a reward/incentive to trade@OfficialApeXdex is a DEX from ByBit
Interface identical
Can recommend trying out https://t.co/JsJlHH5RT0 pic.twitter.com/Le0Y0y8X9d
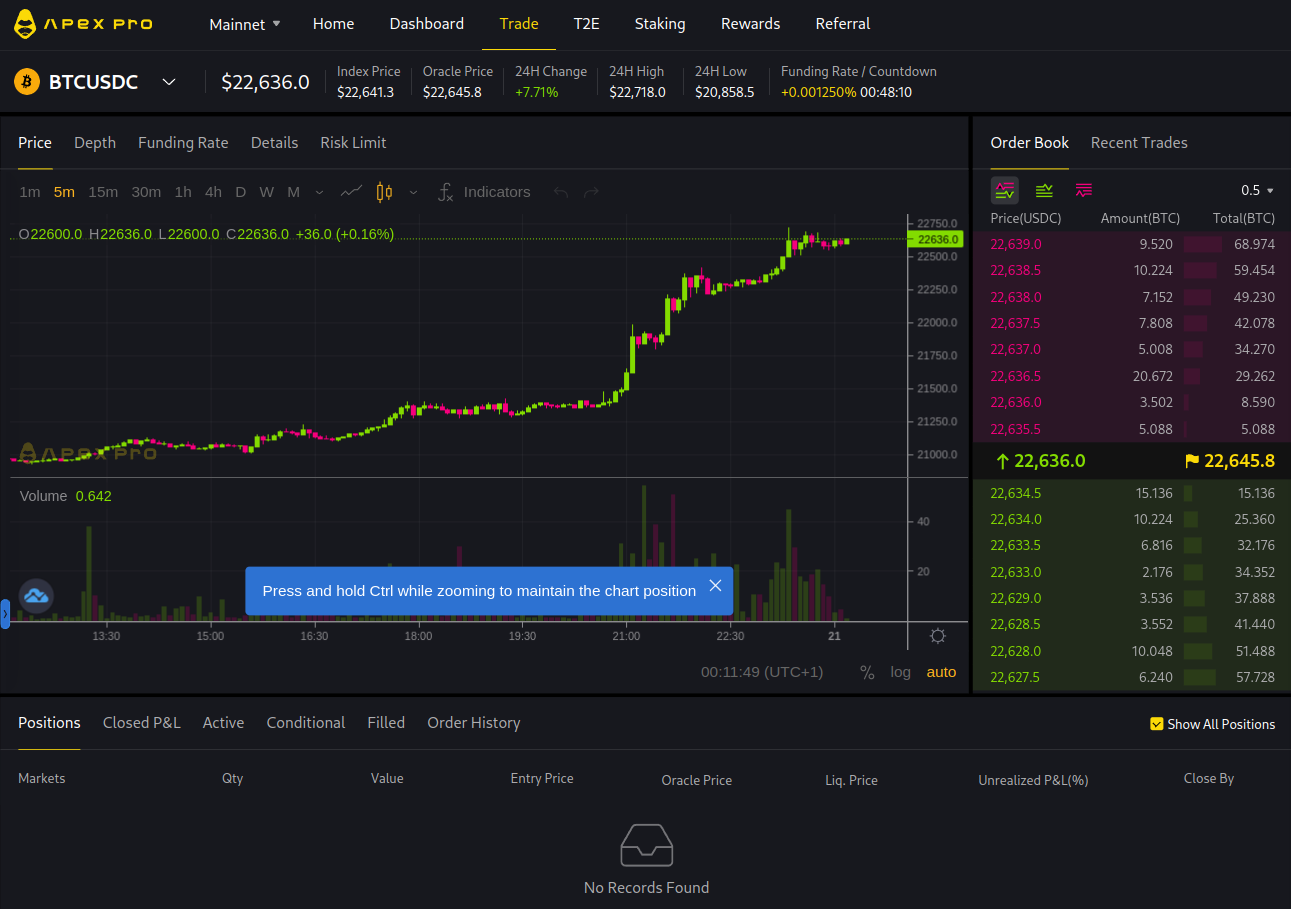
If you need a referral link: https://pro.apex.exchange/trade/BTC-USDC/register?affiliate_id=46&group_id=83
My referral code is: 46
In my opinion, this is the best DEX for trading bitcoin futures.
They also have a mobile app, Android:

Also, an app for iPhone

Ref code = 46
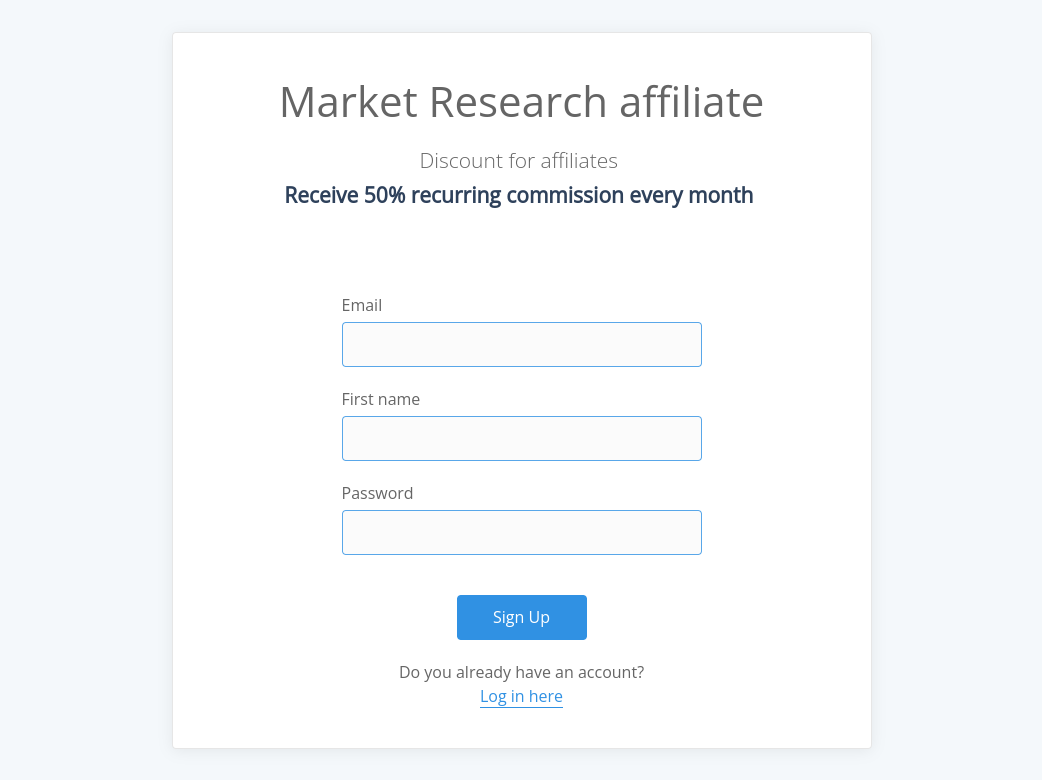
Newsletter affiliate
Receive 50% of the recurring commission every month
Basically, you get a revenue split, which seems fair to me as compensation for promoting/sharing the newsletter with others.