Market Research & airdrop December 5 - 2022

The first week of December is usually a quiet market period; however, this year, we are preparing for the next Consumer Price Index (CPI) and the Federal Reserve meeting.
Broadly, the expectations are that CPI will continue to improve and that the Federal Reserve will raise interest rates by only 50 bps instead of their typical 75 bps hikes. Furthermore, based on Jerome Powell’s latest interview, the markets seem to be looking at Jerome to bring some of that bullish energy into the following year (2023).
Note: Use the player to listen to this article instead of reading
Where are we now?
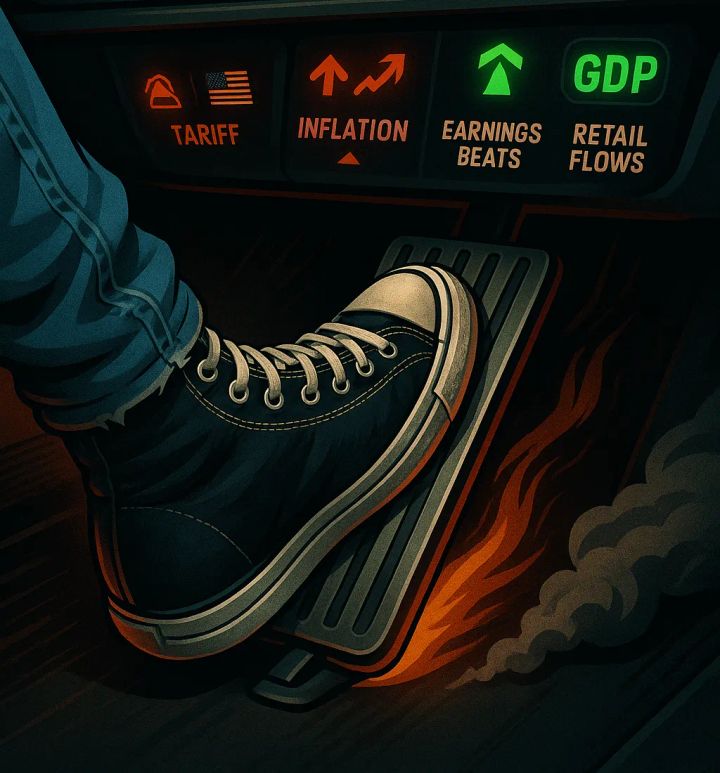
We are currently facing the possibility of a deep recession that could potentially lead to an inflationary depression. This is due to many different factors, such as rising interest rates, a tightening money supply, more expensive energy, and increased threats of war.
The current economic downturn is already happening, even though the data & statistics have not yet caught up. The debt crisis we are now experiencing results from government money printing instead of problem-solving.
Furthermore, countries no longer have the capacity to take on debts by "leveraging to the tits" to land on a soft economic landing. Social security recipients have seen an increase in COLA of 11.2%, the highest in 40 years, resulting in an additional billion of spending.
What is COLA (Cost of Living Adjustment)?
COLA stands for Cost of Living Adjustment and is an increase in Social Security benefits intended to help keep up with inflation. When the cost of living increases, the COLA will increase.
The COLA increase is based on the Consumer Price Index, which is a measure of overall inflation. Since its introduction in 1972, Social Security recipients have seen an average COLA of about 4%. In 2020, however, recipients experienced an increase of 11.2%, the biggest in 40 years. This increase in the COLA will result in an additional billion of spending for Social Security recipients.
Even with this, the inflation rate is likely higher than the CPI data shows.
The CPI is calculated by taking the average price of a basket of goods and services and comparing it to the average price of the same basket of goods and services in the base year. The CPI measures inflation because it shows how the prices of goods and services have changed over time.
The CPI understates inflation. That means that the inflation rate is likely higher than the CPI indicates. That's because the CPI does not consider how the cost of goods and services has changed relative to wages or changes in the availability of goods and services.
For example, the cost of health care has increased dramatically in recent years, but the CPI does not take this into account. This means that the CPI will not adequately reflect how much people's incomes and savings are being eaten away by inflation.
So it's important to remember that the CPI understates inflation
While some argue gold is the only true money, others prefer to invest in real assets to protect themselves if the financial system implodes.
Stagflation
Stagflation is a term coined by British politician Iain Macleod in 1965 to describe the situation of high inflation and high unemployment at the same time.
It is a rare event in modern times, and most economists do not have the experience to know why it happens and how to solve it. There are several theories about the cause of stagflation, but the most likely explanation is that it is the result of central bank intervention.
The Federal Reserve has been engaged in a cycle of quantitative easing (QE) and interest rate hikes over the past few years. The QE program was implemented in response to the financial crisis of 2008, and it involved the Fed printing new money and using it to buy government bonds and other assets. That increased the money supply and helped to lower interest rates. The Fed then began to raise rates in response to inflation concerns, but the timing of the rate hikes was not "ideal."
The Fed raised rates too slowly in response to inflation, which made inflation entrenched in the economy. Now, the Fed is trying to normalize interest rates, but the process is proving to be very difficult. The Fed is caught between a rock and a hard place.
Raising interest rates too quickly risks triggering a recession, but if they raise interest rates too slowly, then inflation will remain.
The situation is worsened because the US economy is addicted to cheap money.
"Cheap money" refers to the low-interest rates that have existed for many years. These low rates have encouraged borrowing and spending but have also made it difficult for savers to earn a decent investment return.
The problem with stagflation is that it is complicated to solve. The Fed cannot lower interest rates because that would further stoke inflation. And, because the economy relies on cheap money, raising rates too quickly could trigger a recession.
So, the Fed is in a bind. It is unlikely to halt rate hikes until a deflationary event occurs. In the meantime, the costs of everyday necessities will remain high, and the situation will likely worsen.
Enjoy reading these blogs? Subscribe
Subscribers will be notified of new postings and have unrestricted access to the blog.
Covering current market conditions combined with educational content
Equities, Forex, Stocks, Bitcoin, Cryptocurrency/Altcoins & Options
https://romanornr.ghost.io/#/portal/signup
Volatility in the equity markets
Generally speaking, when realized volatility is high and implied volatility is low, it indicates that options are getting "cheap."
An indication that the market might be underestimating the amount of future price movement.
The gap between 1 month's implied and realized volatility, the difference between how the market expects to move vs. how much it has actually moved, is wide.
So people might underestimate a price movement with magnitude, So buying options as a hedge looks tempting
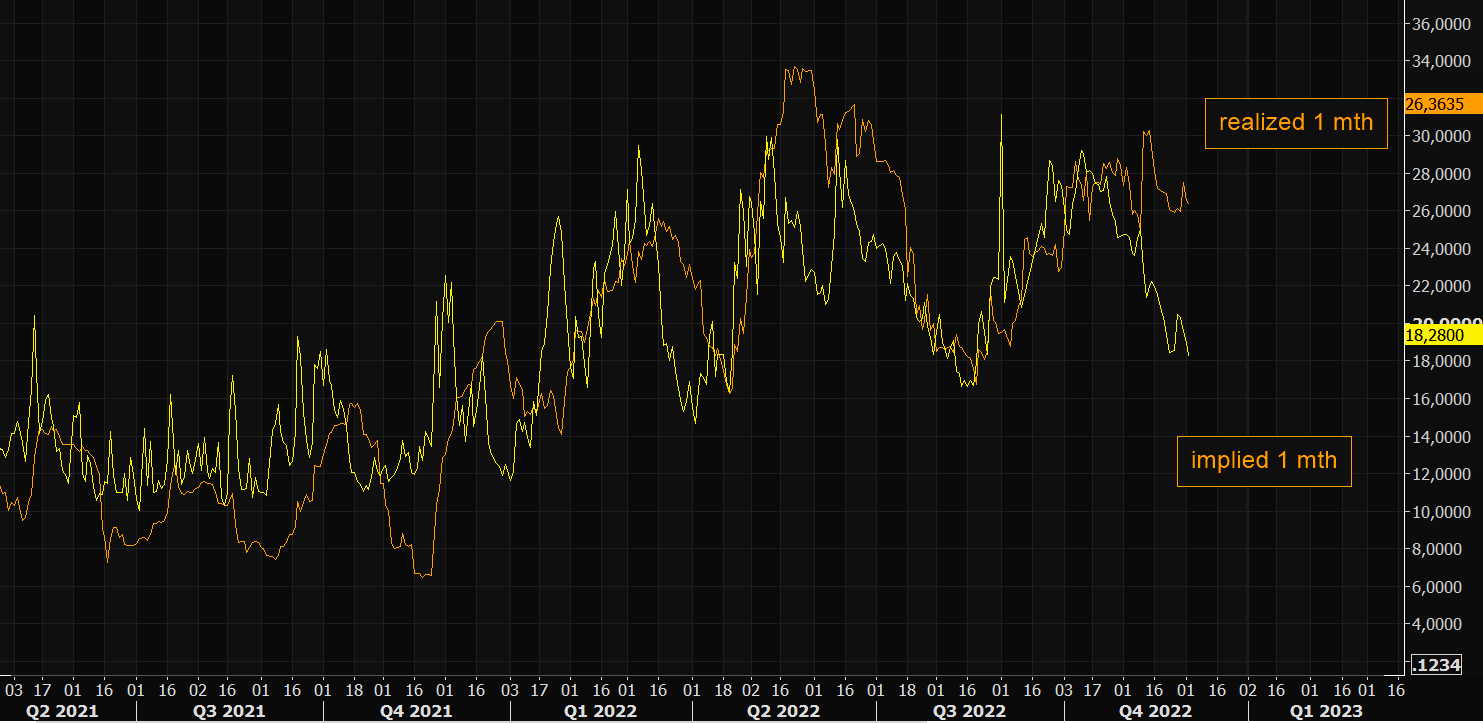
A"strategic long volatility" trade opportunity might exist, where you can buy options and hedge your delta with futures to stay delta neutral.
(Don't forget to continuously hedge your delta)
SPX500 Option Gamma
Quick memory refresh about option Gamma
Gamma is a measure of the rate of change of an options contract's theoretical value with respect to changes in the underlying asset's price.
In other words, it tells us how much the theoretical value of an options contract changes when the price of the underlying asset changes.
If an options contract has a high gamma, it means that its theoretical value will change quite a bit when the underlying asset's price changes. That is because the options contract will have a higher delta when the underlying asset's price is closer to the options contract's strike price.
Delta is a measure of how much an options contract's theoretical value will change when the underlying asset's price changes. It tells us how much of the underlying asset's price movement will be reflected in the options contract's price.
If an options contract has a low gamma, it means that its theoretical value will change only a little when the underlying asset's price changes. That is because the options contract will have a lower delta when the underlying asset's price is further away from the options contract's strike price.
The gamma of an options contract is highest when the underlying asset's price is closest to the options contract's strike price.
Short-selling put options and call options to have a negative gamma while buying call options and put options have positive gamma.
Gamma is positive when the underlying asset's price is above the strike price.
The gamma of an options contract is zero when the underlying asset's price is equal to the strike price.
The delta of the options contract will be 0.5 when the underlying asset's price is equal to the strike price.
The delta of an options contract tells us how much the theoretical value of the options contract will change when the underlying asset's price changes. It is the slope of the delta of the options contract's theoretical value curve with respect to the underlying asset's price.
As expiration approaches, the gamma of an options contract will become less or less negative if the underlying asset's price is below the strike price.
This is because the delta of the options contract will approach 0 as expiration approaches.
The closer an options contract is to expiration, the more sensitive it is to changes in the underlying asset's price.
That is because the time value of an options contract decreases as expiration approaches. The time value of an options contract is the amount by which the theoretical value of the options contract exceeds its intrinsic value.
The intrinsic value of an options contract is the amount by which the underlying asset's price exceeds the strike price of the options contract. If the underlying asset's price is below the strike price, the options contract has no intrinsic value.
If you want to learn more about options, gamma, etc
Read my medium article series about options: https://romanornr.medium.com/list/options-trading-fce6d05f0412
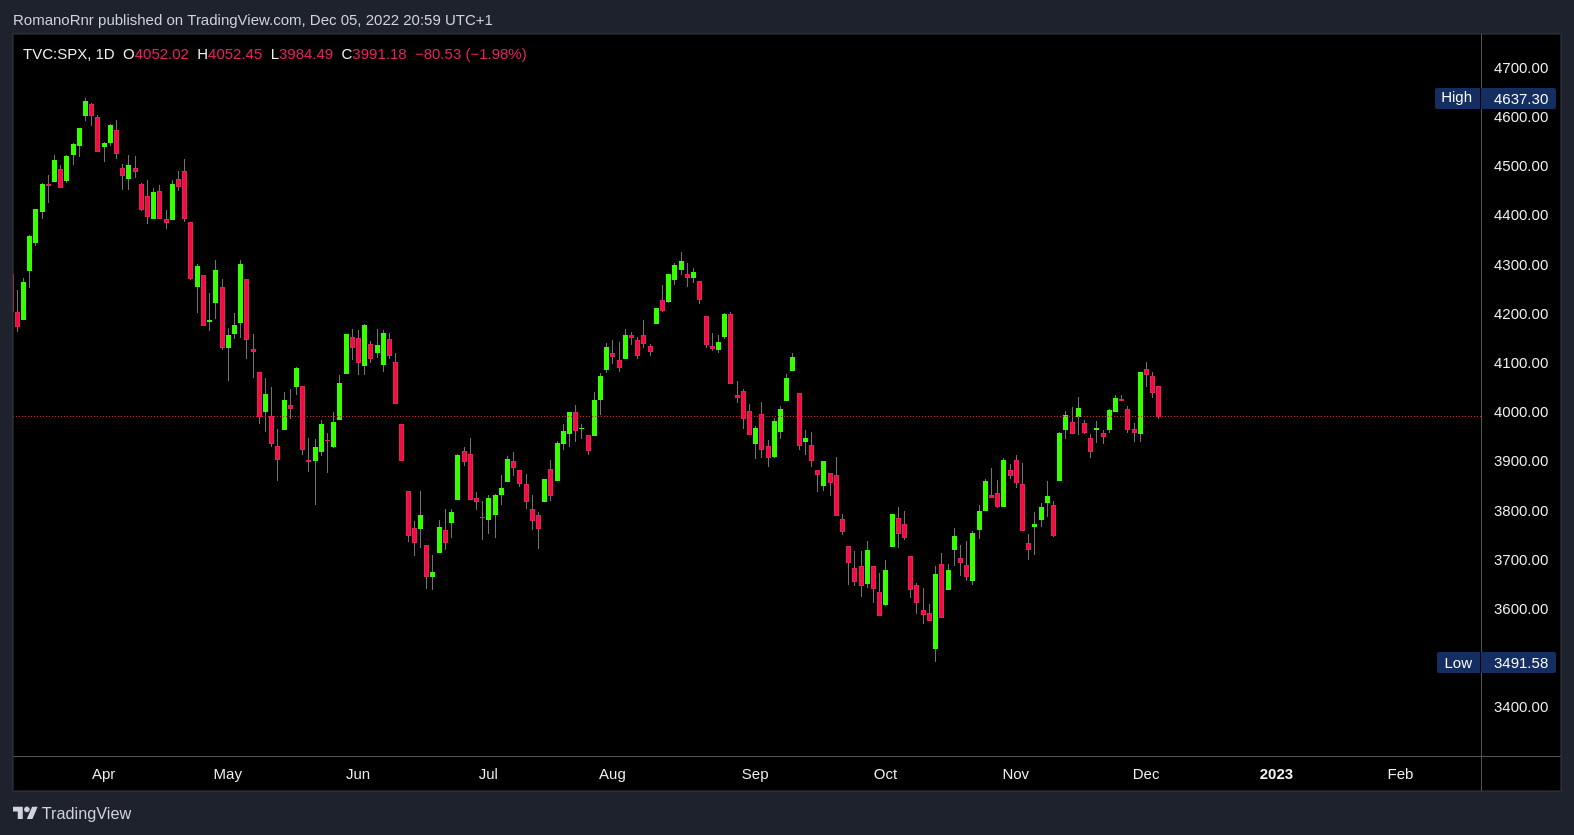
In this case, the S&P 500 index (SPX500) is currently priced at ~$4000 and pinned between $4050 and $4100.
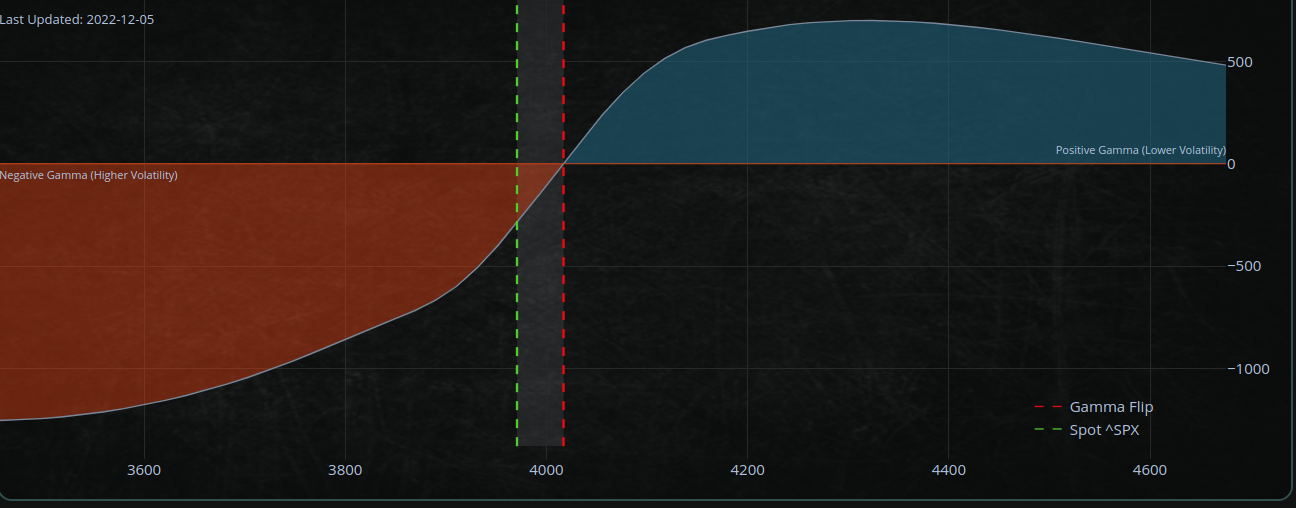
As volatility decreases and the deltas on the out-of-the-money (OTM) options fall, this decreases the dealer's exposure to the upside, and buying may take place on calm days.
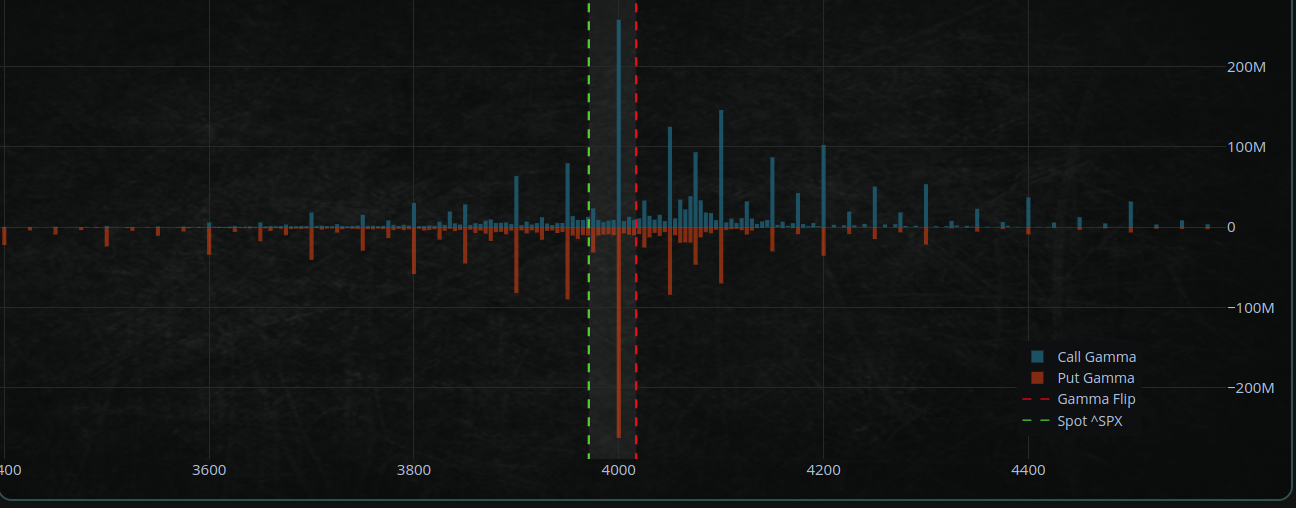
This indicates that the gamma exposure on this position is currently low, meaning that the exposure to the upside and downside is limited if the underlying asset price changes.
Bitcoin flow pace
Here's a chart including the Flow pace into pace into publicly listed Bitcoin funds, including Bitcoin ETFs
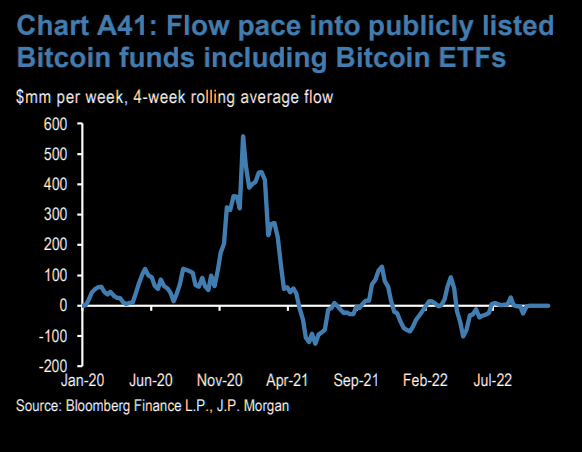
In order to understand the impact of this issue on institutional investors, you can look at this chart displaying the flow of money into publicly listed Bitcoin funds and Bitcoin exchange-traded funds (ETFs) over the last 4-week period.
Institutional investors are starting to take an interest in Bitcoin, but there is still some hesitation due to the lack of liquidity.
Bitcoin production cost
The chart shows the Bitcoin market price ratio to the cryptocurrency's production cost. Under this approach, the cost of producing one Bitcoin is closely related to the cost of the electricity and hardware used to mine it.
This metric is considered more accurate than simply looking at the market price of Bitcoin as it takes into account the cost of production and how it affects the market.
We are getting closer to “reality” in terms of calculating the true value of Bitcoin.
This chart provides insight into how the market price of Bitcoin is impacted by its production cost.
If the production cost of Bitcoin is declining, it means that it is getting cheaper to produce. This could have an effect on the market price, depending on the supply and demand of the market.
If the demand is high and supply is low, and the cost of production is declining, the market price of Bitcoin may increase.
On the other hand, if the demand is low, the supply is high, and the production cost is declining, Bitcoin's market price may decrease.
Ultimately, this could give investors an indication of what could happen to the price in the future, depending on the market conditions.
Vertex airdrop
Vertex Protocol is a decentralized exchange that launched its testnet on November 22. The team developing the protocol has amassed $8.5 million.
It's likely that the protocol will debut its own token, and if you join the network early, you may be able to secure some for yourself.
By the way, I wrote another airdrop article few days ago which is great if you missed it: https://romanornr.ghost.io/market-research-dec-01-2022/
Start using Vertex by connecting your wallet.
Instead of "Metamask," I'm using "Blockwallet" throughout this airdrop guide.
Main reasons for Blockwallet
- Works better with my Trezor and Ledger hardware wallet
- BlockWallet's privacy proxies prevent IP leaks
- Easier to bridge between several networks inside the wallet itself for lower gas
- Built-in defense against front-running bots
- keep track of gas prices across several chains straight in your wallet
- I deleted Metamask
You can download Blockwallet here:

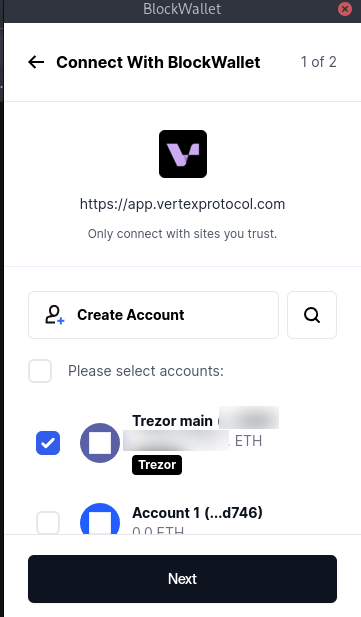
Now visit: https://app.vertexprotocol.com/account/overview
You can connect your Blockwallet or Metamask
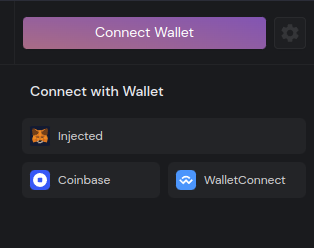
You can press on the Metamask logo for your metamask wallet or blockwallet
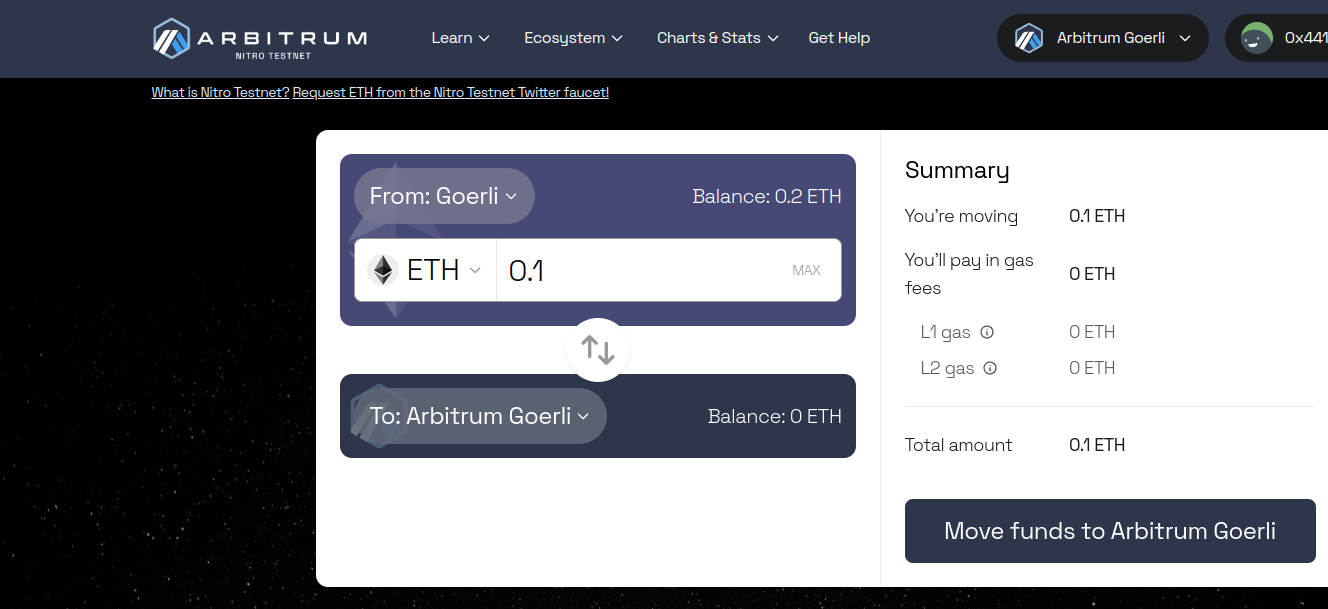
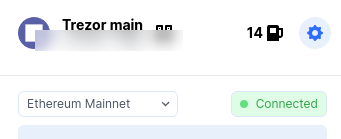
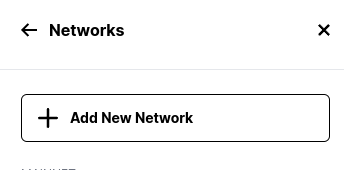
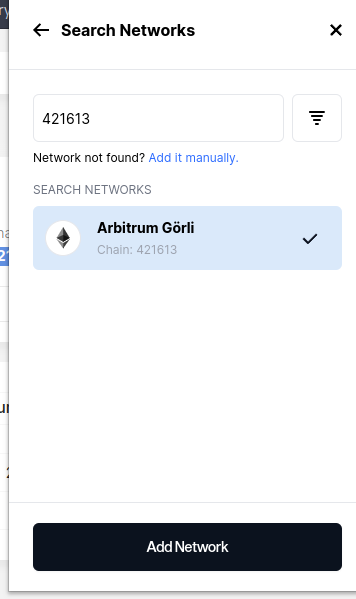
You can use Arbitrum’s Goerli testnet.
After you switched, you can use Vertex faucet: https://app.vertexprotocol.com/account/faucet
You will receive 100 USDC testnet tokens to trade with on the testnet.
If you lack Arbitrum testnet ETH. You can request Goerli testnet ETH tokens here: https://goerlifaucet.com/
Bridge your testnet ETH to Arbitrum testnet:https://bridge.arbitrum.io/