Market Research January 10 - 2023
Brexit Talks - BoE Expects Inflation to Remain High Into 2024
Investors have been closely watching the latest developments in Brexit recently, as the U.K. continues to grapple with its issues tied to the event.
The mini-Budget failed, creating concerns about inflation, strike action, food supply, and a UK-specific energy crisis. At the same time, the Conservative party is dominated mainly by right-wing populists, which limits the potential for well-intentioned interventions.
Inflationary pressures in the U.K. remain high compared to other countries, which could prolong inflation's effect until 2024. However, progress has been made in implementing the Northern Ireland Protocol, which involves a data-sharing system. Nevertheless, the DUP and Conservative party hardliners need to be appeased.
Bank of England's senior economist Huw Pill stated that this is due to the “persistence” of inflationary pressures, and the Bank rate is estimated to reach 4.75% by the summer.
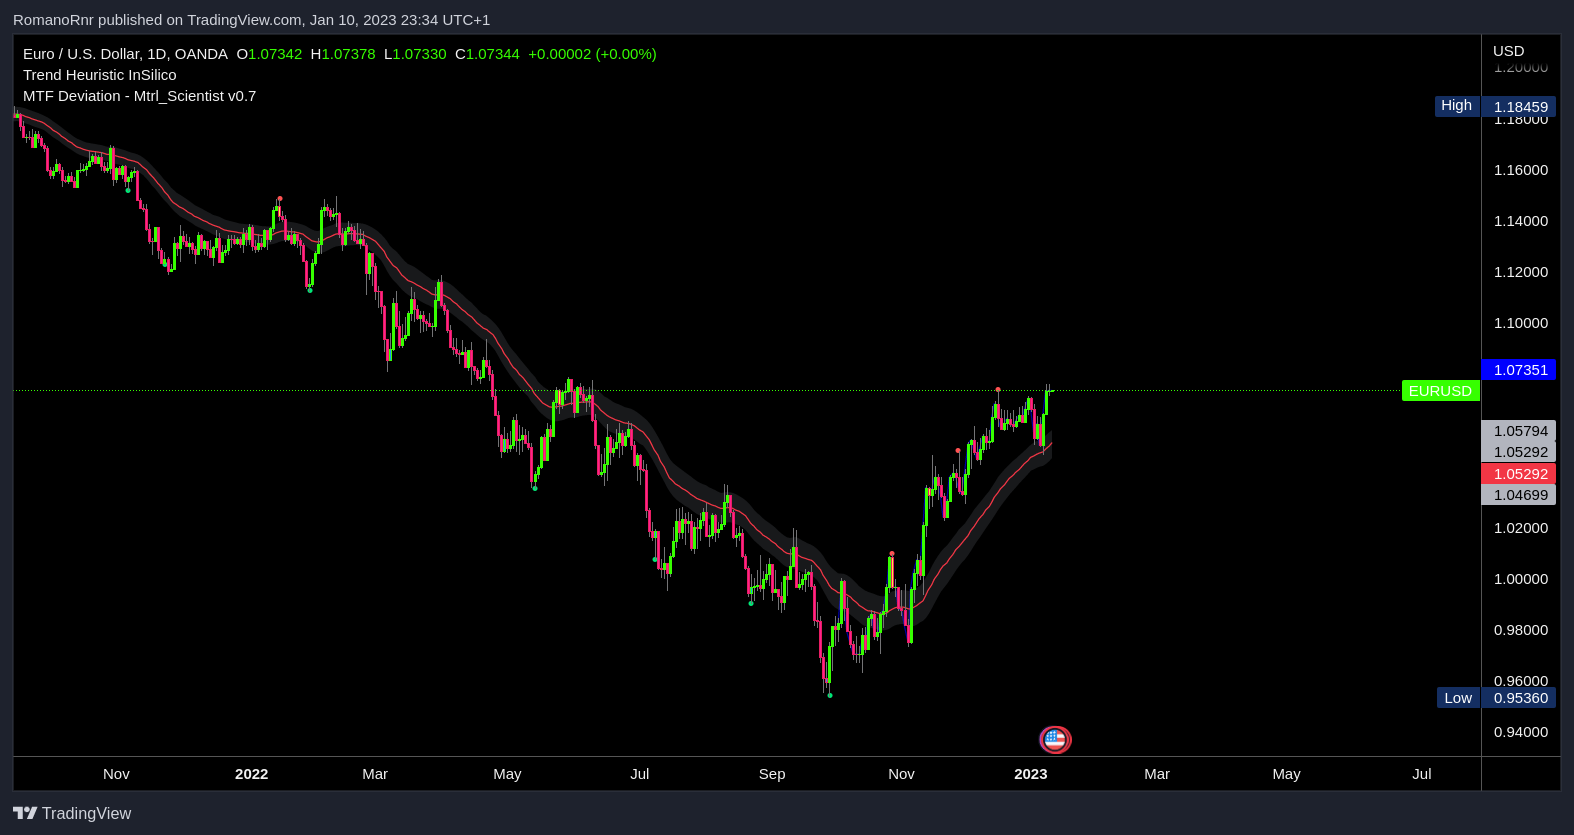
This is further complicated by Fed's Daly and Bostic, with the latter being hawkish on U.S. rates. This has caused the F.X. markets to respond, with EUR/USD at its highest level in 7 months. All of these factors need to be considered when analyzing future market trends.
Moving forward, the “will they/won’t they”-pivot talk will likely continue in the coming months, and investors will have to follow Brexit developments closely. At this point, there is a lot of uncertainty regarding the direction that Brexit will take and how the U.K. will navigate the negotiations.
Use the play button to listen to the article instead of reading
Understanding the Northern Ireland Protocol
A quick rundown, saving you time to look this all up. The Nothern Ireland protocol in the Brexit Withdrawal Agreement aims to ensure a soft Irish border (i.e., no complex physical infrastructure or immigration controls) is maintained on the Island of Ireland. It ensures that Nothern Island will remain aligned with certain E.U. regulations and standards while ensuring that the U.K. operates outside the single market and customs union.
To achieve this, a data-sharing system will be set up, including information from immigrants, customs, and regulatory areas. The system will enable officials to process flows and paperwork between the U.K., Nother Ireland, and Europe. This data-sharing system will ensure no disruption to trade and the supply of goods and services on the island of Ireland, and the E.U. customs regulations are applied to goods moving between Northern Ireland and Great Britain.
Yesterday, the U.K. and E.U. came to an agreement to use Britain's data-sharing system to track shipments to Nothern Ireland. This system provides instant customs, commercial data, and Irish-Sea bound agri-good and industrial supplies. That's the first major step towards the Brexit trade battle, and the further "de-dramatization" and cooperation on trade flows and customs inspections could potentially result in progress in additional issues, such as those regarding the deal's governance and food safety requirements.
Despite yesterday's progress, it remains unclear whether it will be enough to convince Notherland Ireland unionists to return to the Assembly, which they've been boycotting. The DUP has stated that they will not return until their issues with the protocol are addressed. U.S. Democrats are exerting pressure on the U.K. and E.U. to resolve the protocol issues before considering a UK-US trade deal; however, it is unlikely that a comprehensive agreement can be reached in time to satisfy the DUP and Conservative hardliners.
As negotiations regarding the Protocol have been ongoing for more than 6 months, it is anticipated that another deadline will pass without a complete answer. Suppose the U.K. continues to pursue its unilateral Protocol Bill. In that case, there may be further complications to the trade agreement, as the E.U. may view this as an attempt to gain an unfair competitive advantage.
The never-ending cycle: How Over-Investment Ruins Bitcoin Mining
The global economy is heavily dependent on several commodities, such as energy, which has recently seen a surge in demand. This increased demand caused the supply network to strain, leading to price increases and high margins.
With high prices & high profits, capital investment opportunities become more attractive, leading to an increased expectation of return on investment. However, when the demand begins to slow down, surplus investments are revealed, causing the prices to fall, and weaker supply chain links to be cut.
Additionally, complacency can set in when prices are low, only for the cycle to start again when robust demand once again heavily strains supply systems.
An example of this cycle can be seen in the development of natural gas in the early 2000s (2000-2008); prices increased from $2 to $16 per Million British Thermal Units (MMBtu) as demands rose and supply sources struggled to keep up. This signed to energy companies that new sources of supply had to be found.
Capital Investment in Hydraulic Fracturing
As such, a shift towards hydraulic fracturing and horizontal drilling happened, with longer laterals becoming increasingly prominent. That capital investment was justified by the high prices, increased profits, and lower costs that the new technology brought.
However, the influx of capital caused a sharp increase in available supplies, leading to a downturn in prices, decreased profits, and unsustainable debt servicing, which resulted in several energy companies, such as TXU, experiencing bankruptcy, with their assets written off.
This cycle is currently being experienced in the context of Bitcoin mining, with high commodity prices and margins, leading to new investors being attracted to the industry.
Bitcoin Mining Boom Leads to Insolvency
In November 2021, the Bitcoin mining sector saw a surge in activity due to a combination of factors. The value of Bitcoin at that time was at an all-time high of $67,734, while the Hash Spread reached a record high of $550 per Megawatt Hour (MWh). These high prices and mining margins attracted new capital from investors looking to capitalize on the potential profits available in the sector.
Additionally, competition in the sector had been reduced in the period leading up to this boom due to China’s ban on Bitcoin mining, making the sector more attractive for new entrants. With these high prices and margins, investors were enticed to the sector by the promise of rapid investment payback periods.
However, once these investments were made (investors aping in), the profits diminished, putting pressure on the businesses and miners with the final result, yes, you guessed it, Insolvency. A tale as old as time.
Bitcoin mining lenders and borrowers find themselves in a difficult financial position and resort to bankruptcy. This is likely due to the current profitability of the mining operations' inability to service the financial obligations they agreed to.
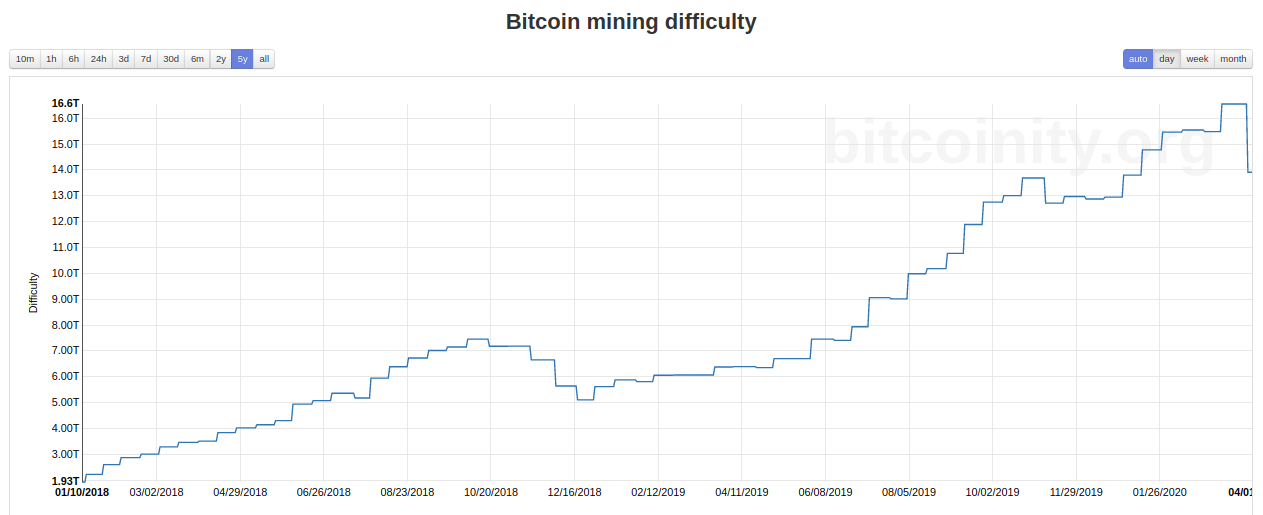
Bitcoin is currently undergoing a difficult market cycle. This cycle is notable because investment from institutional miners played a much bigger role than in past cycles. The current downturn looks like the classic pattern of a boom and bust business cycle, as always. (The boom and unavoidable bust is just a part of capitalism. There's always a bust; it's never "different this time")
Talking about difficulty, let's look at the mining difficulty.
Traders are trying to find the bottom of the market. At the same time, credit markets are providing excellent opportunities for investors to earn high yields in a low-price environment with the potential for recovery.
Therefore, instead of predicting when the cycle will end, it is best to focus on having a disciplined capital strategy to prepare for the next cycle.
Therefore, disciplined capital should be utilized to gain the most from the current situation.
Credits to One River Digital Asset Management LLC
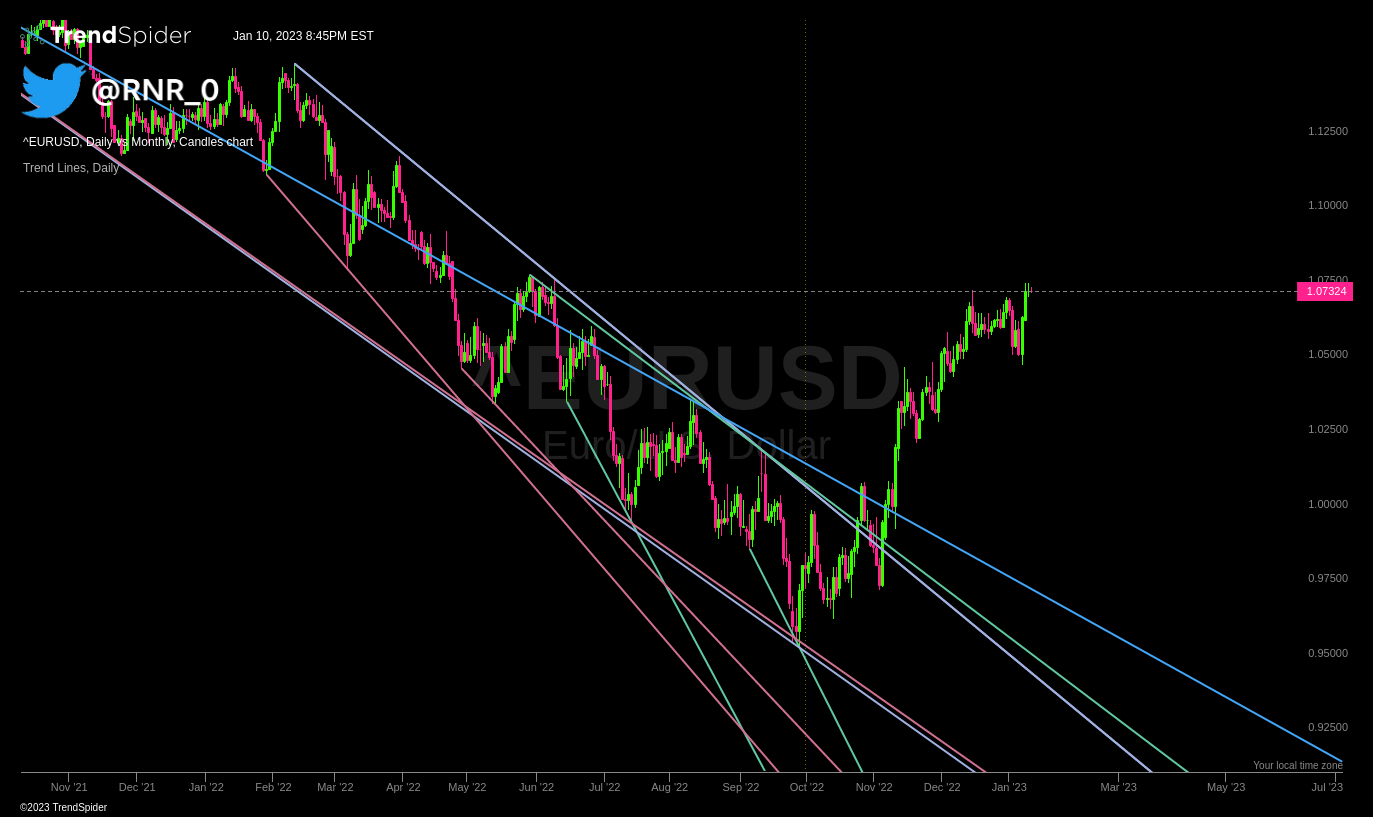
One-way F.X. Trade - Euro long
First order of business, let's explain F.X. positioning.
F.X. positioning measures a trader's relative positions on a given currency pair. It's calculated by subtracting a trader's short position from its long position.
The one-way F.X. trade is a strategy of buying currency while selling another currency to capitalize on the exchange rate movement. The settlement takes place on the spot date at which the trade takes place, and this is also called the "spot rate."
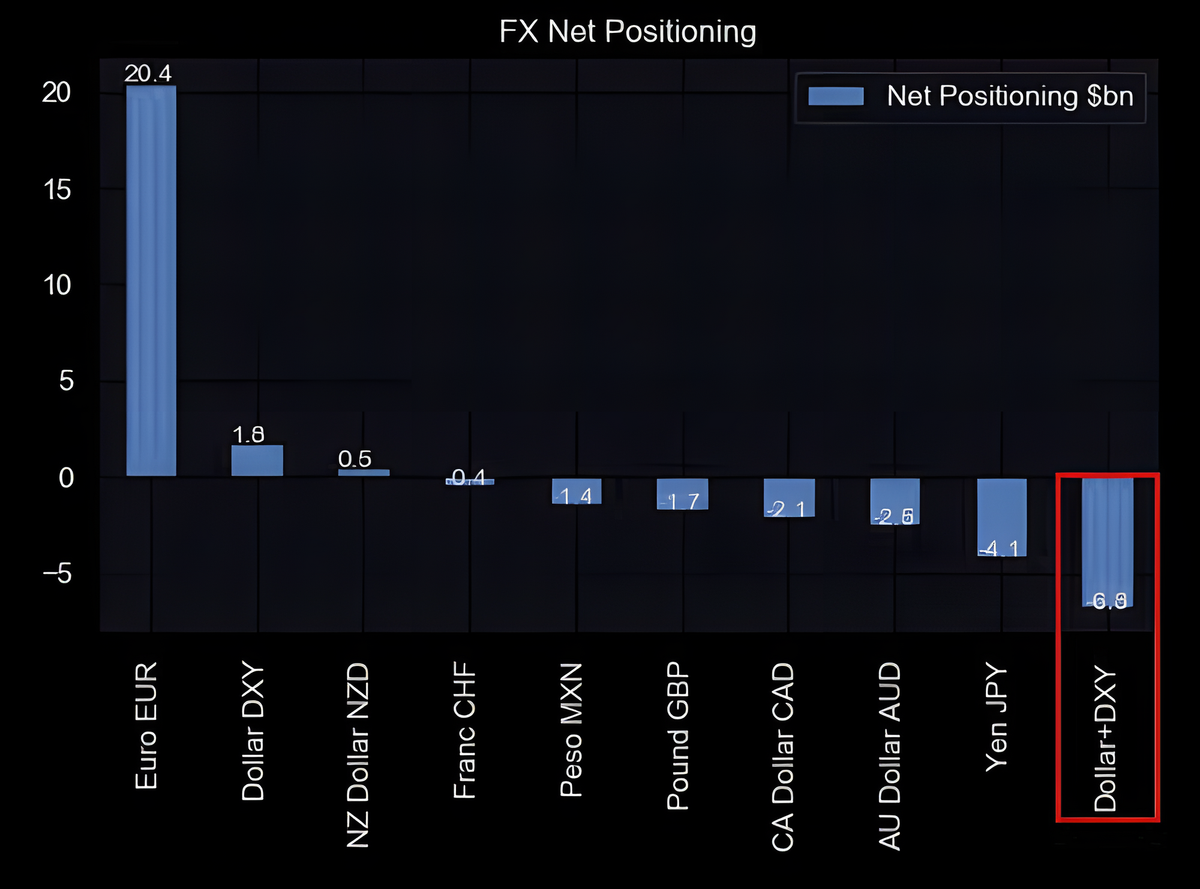
This data represents the net F.X. positioning in various currencies. It shows that they have a net position of 20.5 billion dollars in the Euro, meaning that they are long (have bought) the Euro relative to other currencies.
They also have a net position of $1.8 billion in the U.S. Dollar (DXY), meaning they have mild exposure to the U.S. dollar.
They also have a net position of $0.5 billion in the New Zealand dollar and $0.4 billion dollars in the Swiss Franc.
On the other hand, a net negative position of -$1.4 billion dollars in the Mexican Peso, negative -$1.7 billion in the British Pound, -$2.1 billion dollars in the Canadian dollar, negative -$2.5 billion dollars in the Australian dollar and negative -$4.1 billion dollars in the Japanese Yen.
Lastly, a net position of negative -$6.8 billion in the combination of the U.S. Dollar and DXY, meaning that they have an even stronger negative or short exposure to the U.S. dollar compared to the other currencies they hold.
- N.Z. Dollar: $0.5 billion, a net long position
- Franc CHF: $0.4 billion, a net long position
- Peso MXN: -$1.4 billion, a net short position
- Pound GBP: -$1.7 billion, a net short position
- C.A. Dollar CAD: -$2.1 billion, a net short position
- A.U. Dollar AUD: -$2.5 billion, a net short position
- Yen JPY: -$4.1 billion, a net short position
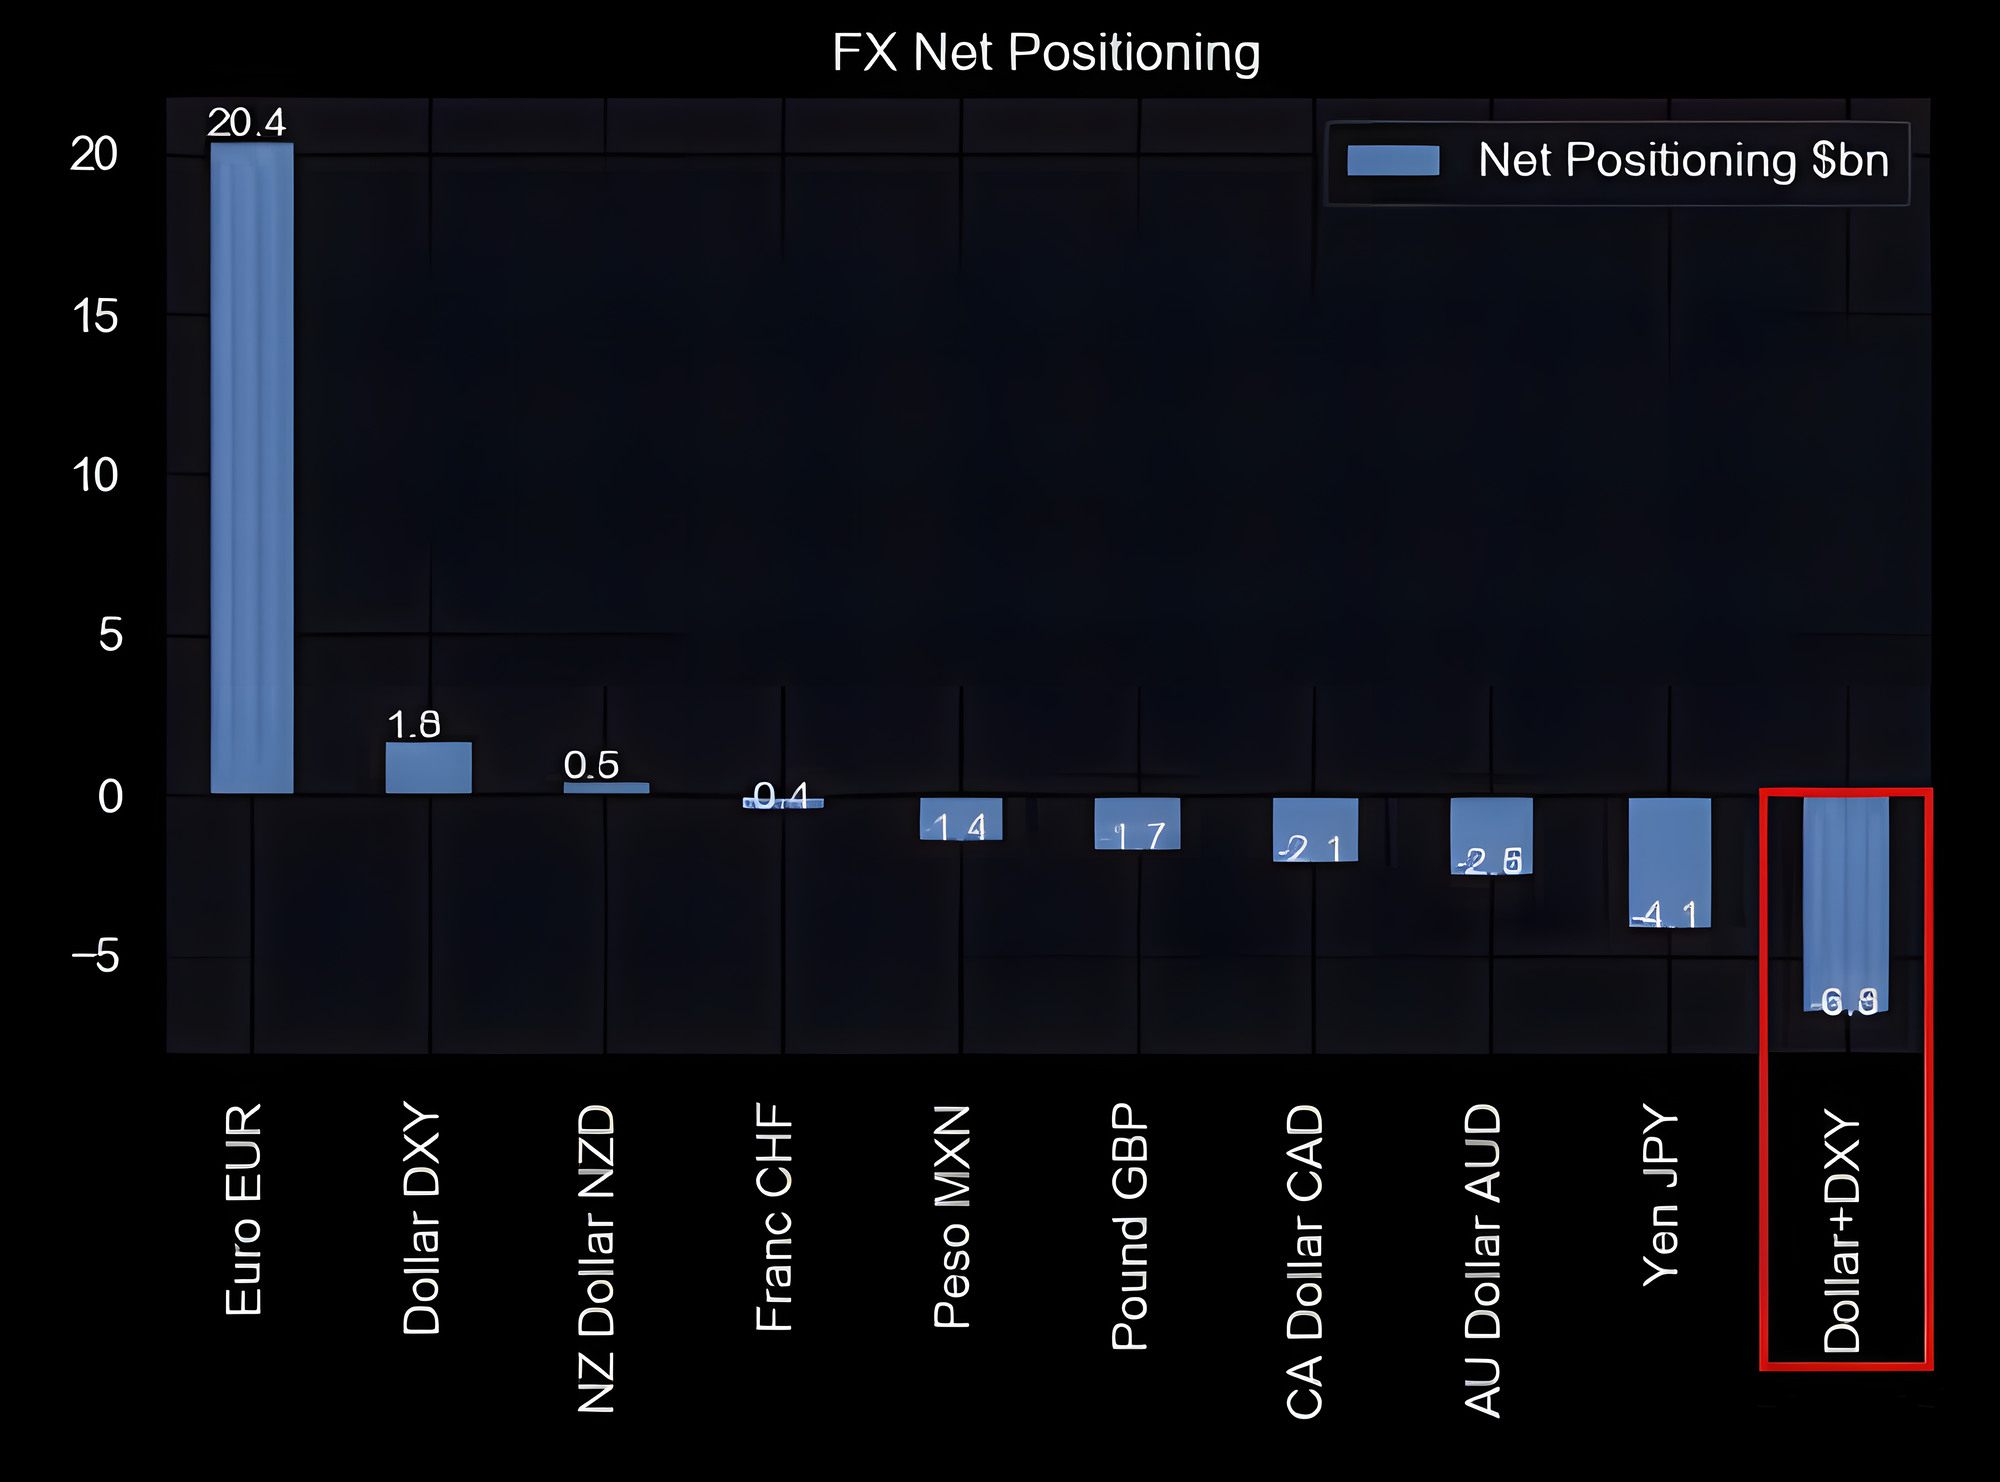
So a large long position in the Euro relative to the other currencies and a large net short position in U.S. dollar exposure.
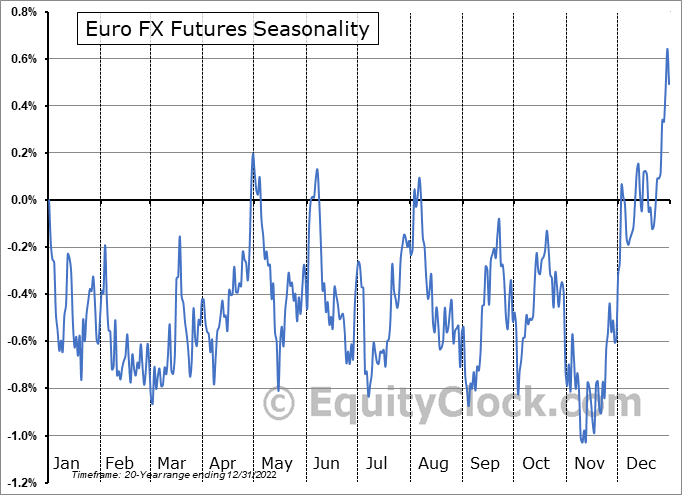
Euro seasonality
Euro seasonality is a pattern of market performance for the euro, generally during the months of November and December.
During these months, European stock markets tend to experience higher levels of activity and performance compared to other times of the year. This phenomenon is often referred to as the "Euro seasonality effect".
This seasonal pattern is typically driven by investors making strategic investments or taking profits from their investments during the period and increased demand from the retail investing sector.
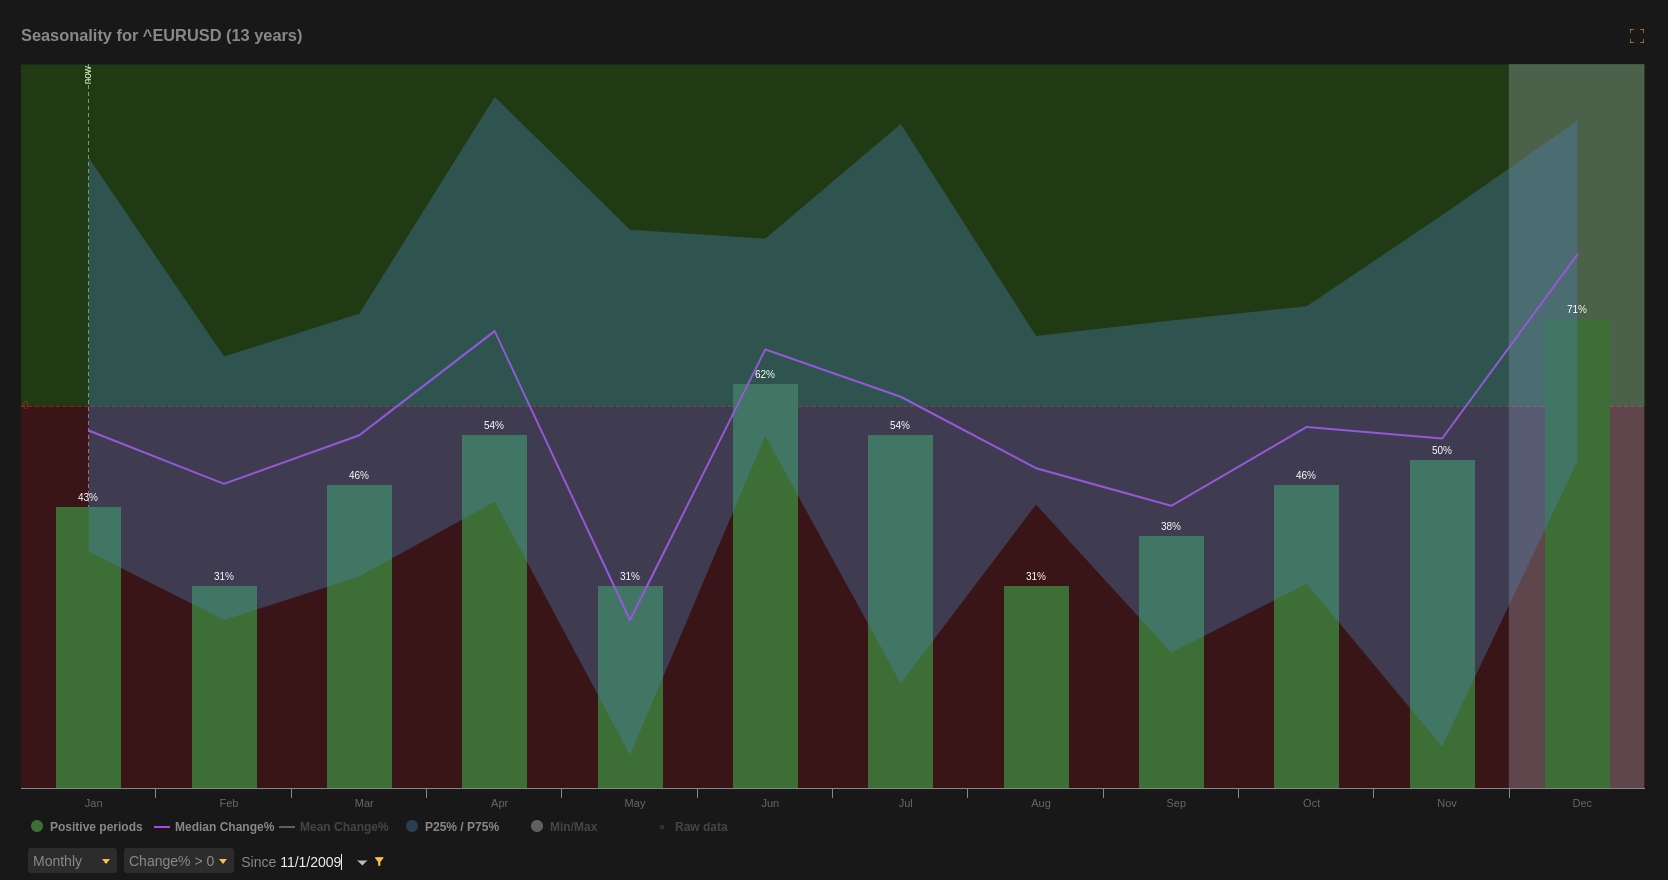
Usually, the positive effect typically seen during November and December fades from January onwards as the market returns to its more typical performance level. This means that while investments were made during November and December.
JPMorgan: Limited Downside for Oil Prices, Increased Demand, and OPEC+ Output
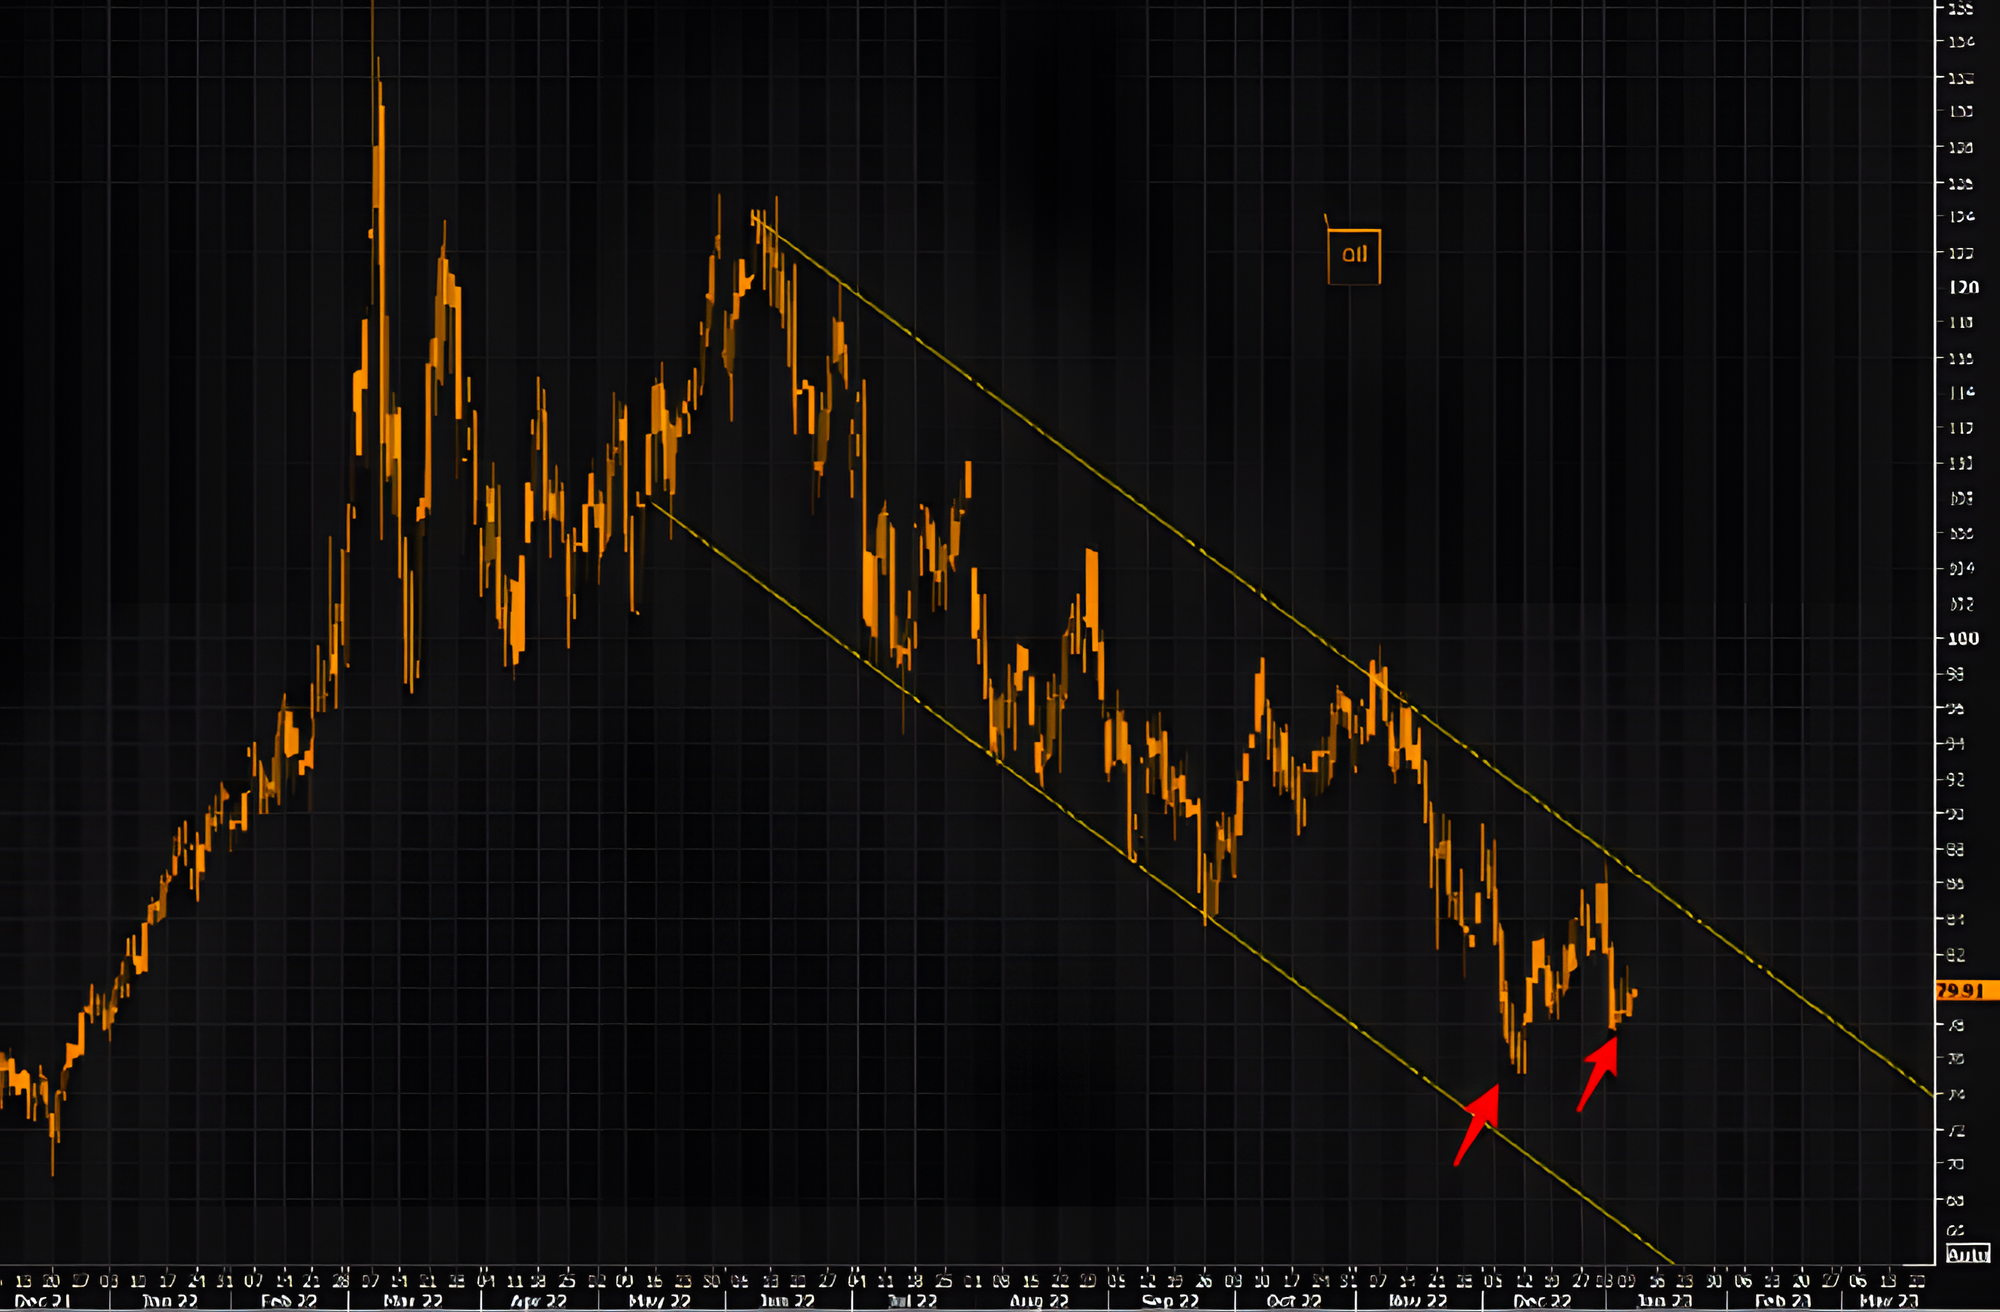
Oil prices have been trending downward since their highs in June.
JPMorgan is predicting that the price of oil will soon start to rise again due to an increase in demand after the Chinese New Year, as well as the potential of an OPEC+ (Organization of Petroleum Exporting Countries Plus) cut of 400-500 thousand barrels per day.
This chart shows a potentially higher low on the price of oil, although momentum is still weak. Any downside from the current price could be limited as long as the OPEC+ cut goes through and demand after the Chinese New Year is robust. It is recommended to take a cautiously optimistic approach to trade oil at the current time.
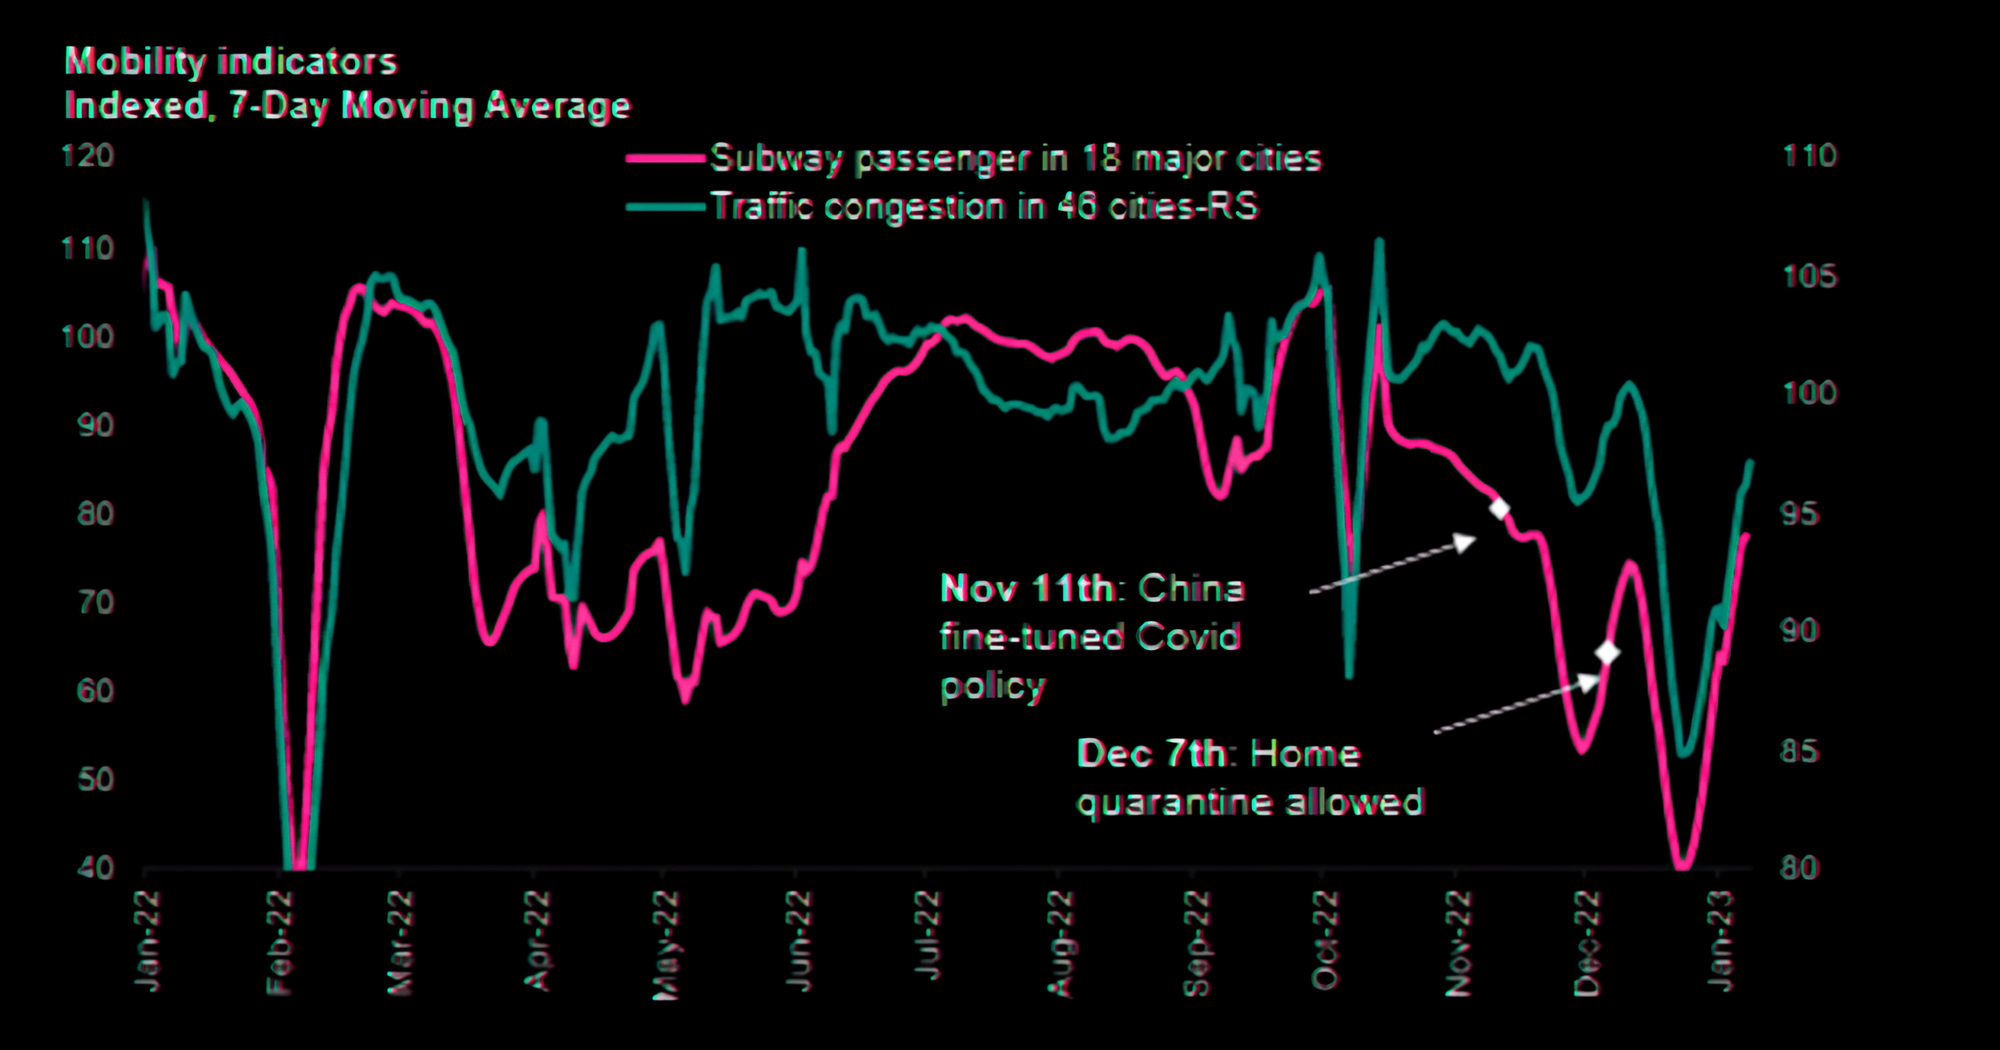
China to See Stronger Economic Recovery in 2023
Let's start reviewing a graph from Morgan Stanley. The Morgan Stanley China economics team is predicting an earlier and stronger growth recovery from 1Q23 due to faster reopening, stronger housing support, and tech regulation.
This would result in GDP growth of 5.7% in 2023, an increase from the original predicted number of 0.3ppt.
Also, data from the Energy & Chemical research team at Morgan Stanley shows that oil demand is expected to grow by 5.5% in 2023, with a 4% growth in refined oil products demand reaching 2021's level. Data shows there is likely to be a strong economic recovery in China in 2023.
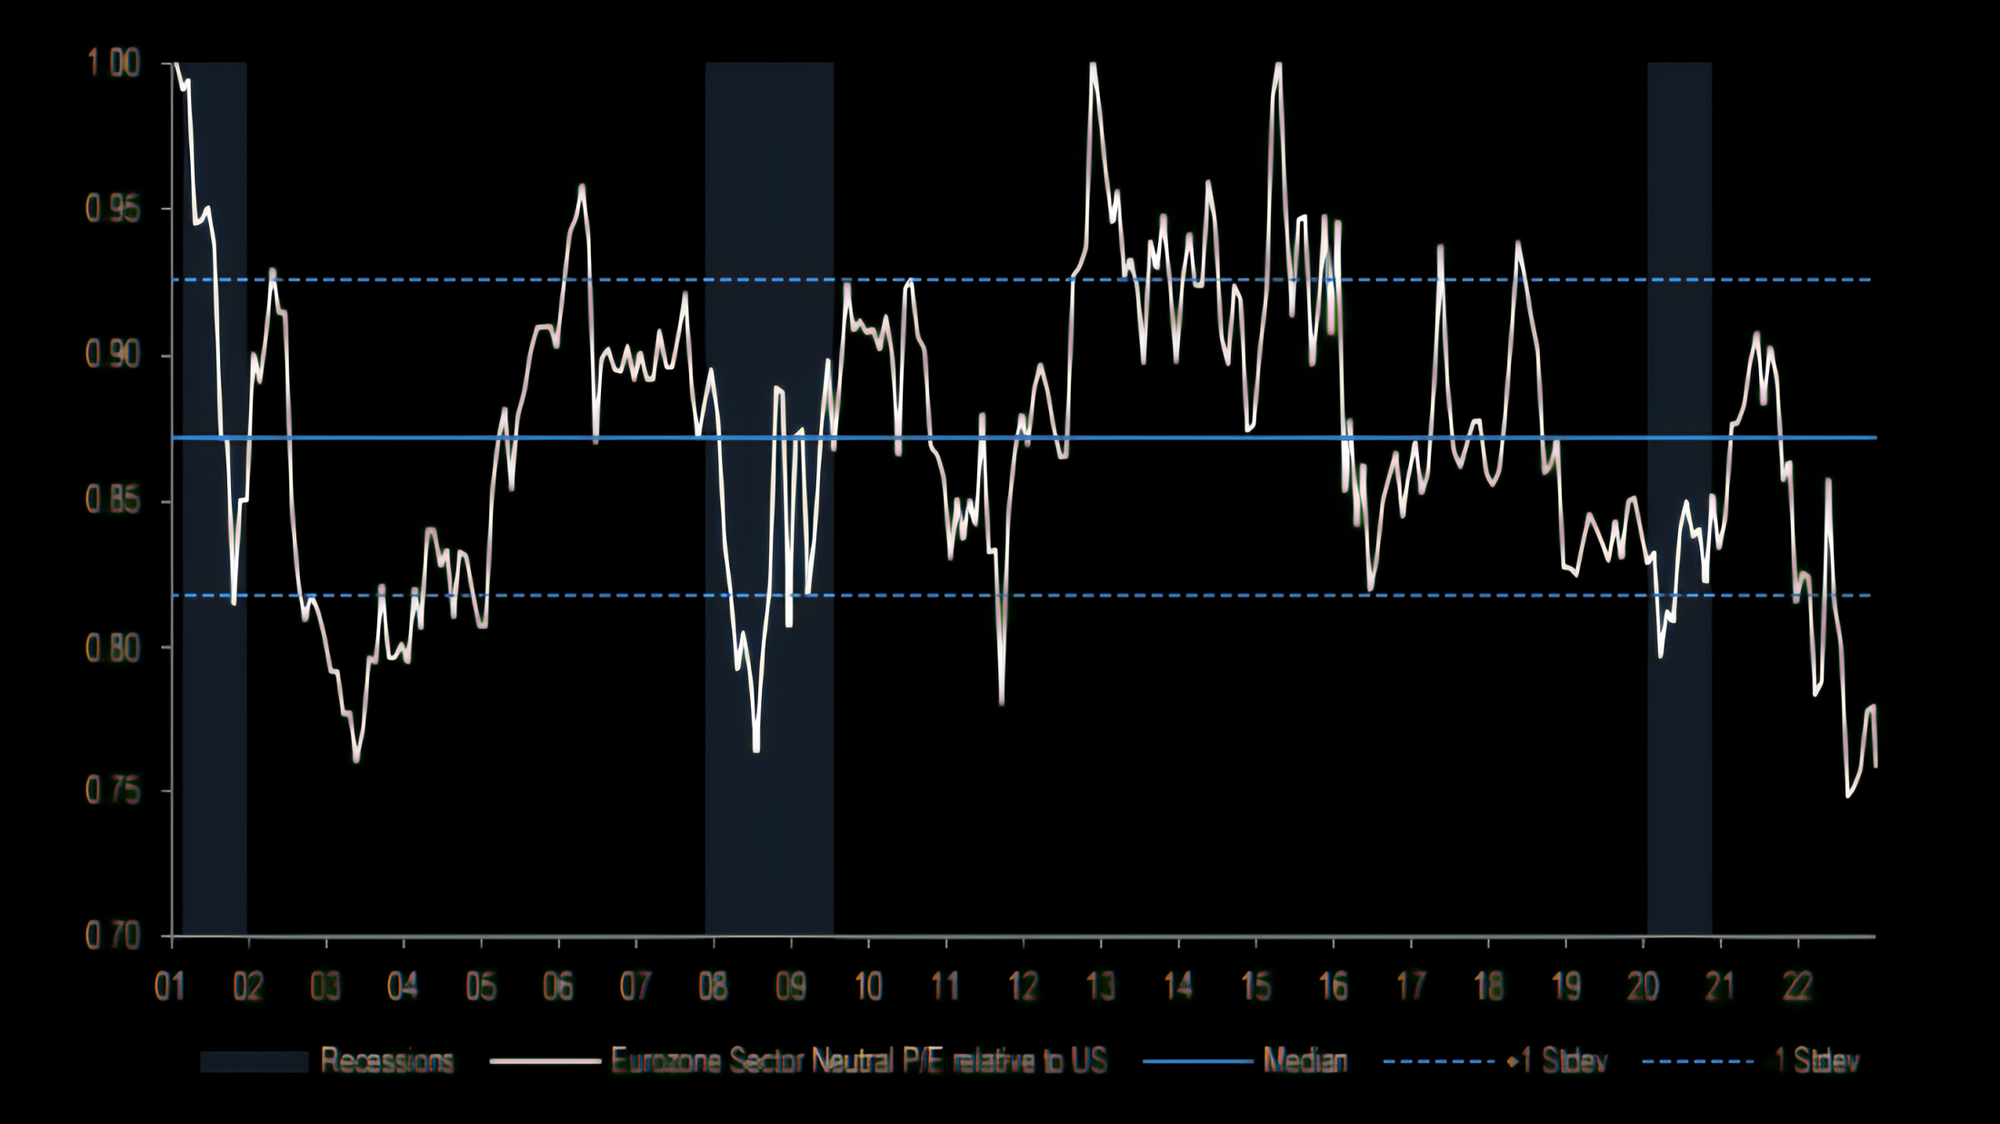
European stocks trading cheaper than U.S. counterparts
The MSCI Eurozone sector neutral P/E (price-to-earnings) relative to the MSCI US is showing that Europe is now outperforming in common F.X. (foreign exchange).
This means that European stocks are trading at a much lower relative price-to-earnings ratio compared to their U.S. counterparts, making them much cheaper for investors to buy.
The European market is an attractive area to invest in, given the cheaper valuations potentially.
(It is important to note that this information should not be considered a recommendation to buy but is provided as a general observation
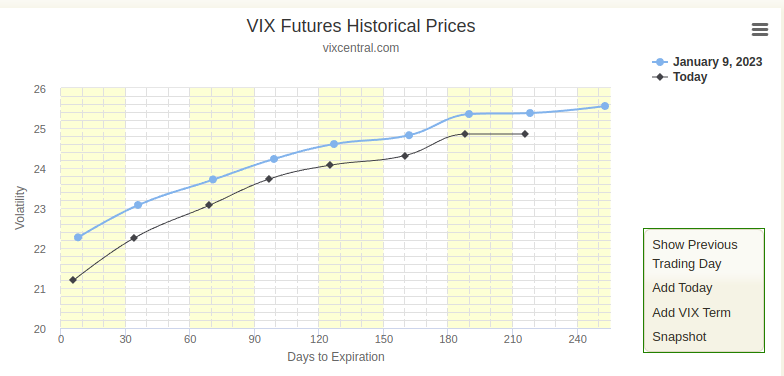
VIX Term Structure Shifts Lower, Offering Long Volatility Opportunity
The VIX term structure is a chart that illustrates the relationship between the VIX (volatility index) and the prices of options related to the S&P 500 Index.
It plots the current level of the VIX, as well as the implied volatilities of options expiring in the immediate future (the “front month”) and in later months (the “second and third months”).
Recently, the VIX term structure has shifted lower, indicating that the market is becoming less volatile. This shift is seen mostly in the shorter end of the curve, suggesting that traders may be expecting volatility to subside over the short term.
However, a potential opportunity of taking a long volatility position before the release of the Consumer Price Index (CPI) is to take advantage of the lower levels of volatility.
If you're interested in learning more about options, I highly recommend reading the series of articles I wrote about options trading
https://medium.com/@romanornr/list/options-trading-fce6d05f0412
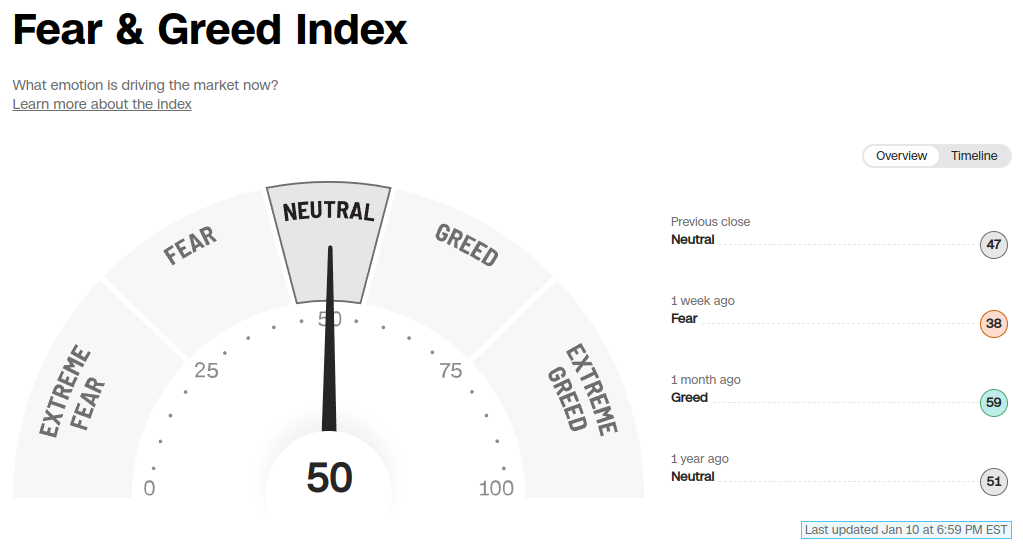
Fear & Greed Index
No fear, no greed. Neutral.
I think that's enough for today. It took me 4 hours to write.
This Market Research article is only for paid subscribers this time.