Market insight June 3, 2022
Volatility Targeting Strategies
Volatility is the most prevalent measure of a stock's risk. The volatility targeting strategy is a method for managing a portfolio's exposure such that its volatility is as near as feasible to the target value. In other words, the strategy is used to ensure that the dollar risk remains constant.
The portfolio manager does this by adding or lowering leverage based on market volatility.
If volatility increases, the portfolio manager will reduce its size. If volatility decreases, the portfolio manager will increase leverage. The volatility goal is the yearly volatility level to which the portfolio is geared.
Investors often avoid "volatility targeting strategies" during market declines to protect their wealth. That reduces the amount of money entering the market, contributing to the downward pressure.
However, when markets are rising, investors are more inclined to attempt this strategy to capitalize on the possible gain. That causes additional money to enter the market, which may drive up prices.
The outflow of funds from "volatility targeting strategies" yesterday proved the impact of declining realized volatility and positioning—more outflows due to the BLS Employment report before the market opened.
BLS employment?
The BLS Employment report measures the number of people employed in the United States. This report is released monthly and can significantly impact the markets. A strong report could lead to more money flowing into the market, as investors feel confident about the state of the economy. A weak report could lead to outflows, as investors become concerned about the economy's future direction.
Gamma
Expect that the upcoming employment report will be weaker than expected. However, even if the report is weaker than expected, markets can move up due to the Vol Targeting flows.
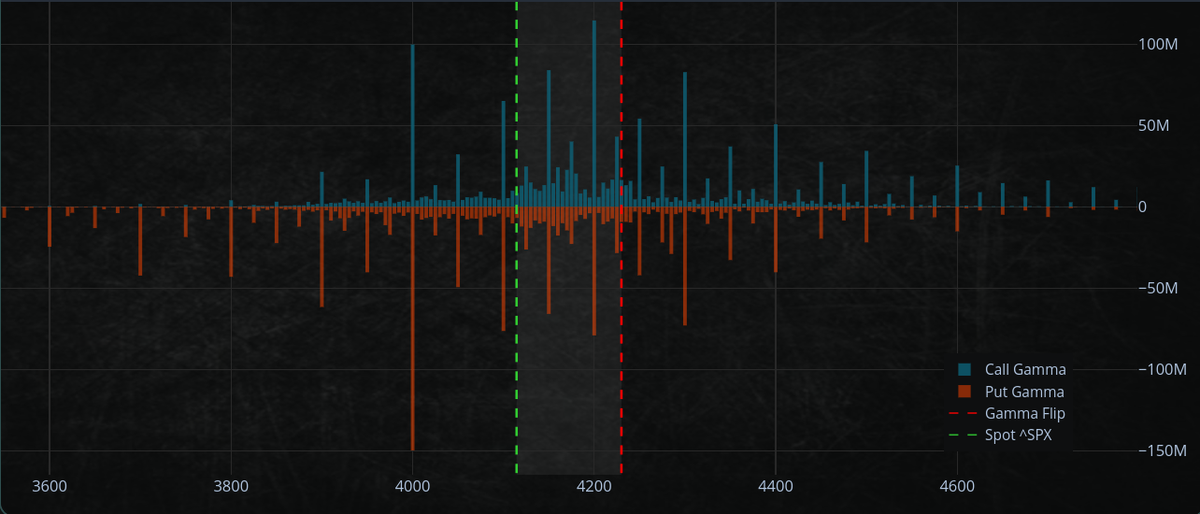
I think the dealer gamma is within the margin of error of being neutral.
Dealer Gamma is a measure of how much a derivative's price will change in relation to the underlying asset.
A zero gamma should not be seen as a single line but rather as an uncertain region around a level since numerous parties' location, and risk limitations interact within this range.
However, we are not at the "all clear" stage that a substantially positive gamma score would indicate, so investors should still expect intraday volatility with a short-term bullish tilt.
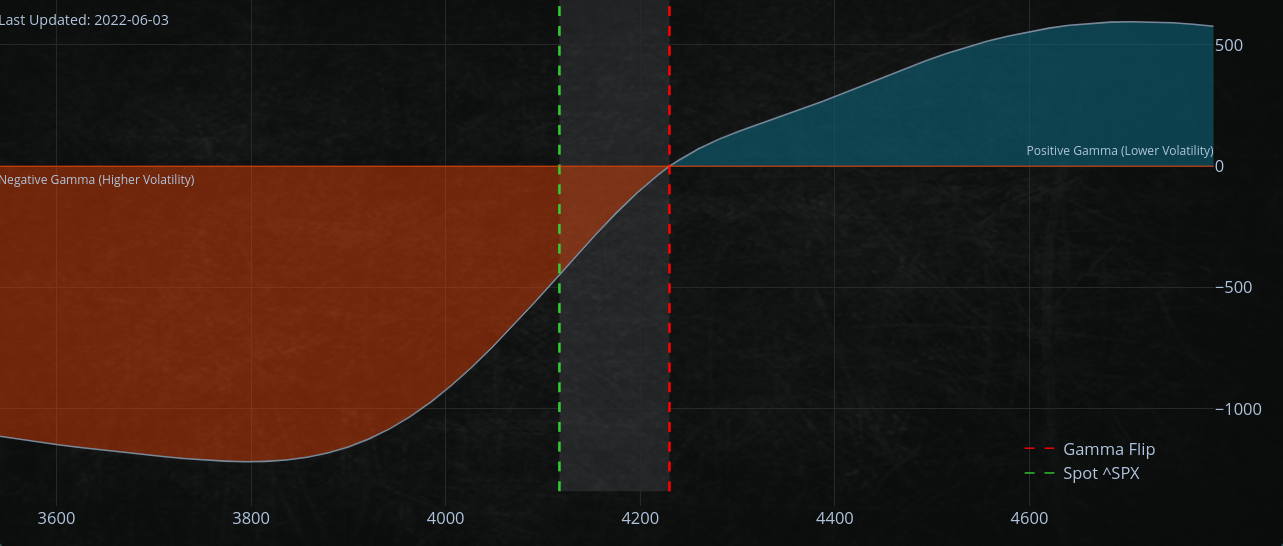
We are still in "negative gamma land."
So we are still experiencing negative gamma. That will likely cause increased intra-day volatility as dealers will be forced to buy or sell securities to keep up with market changes.
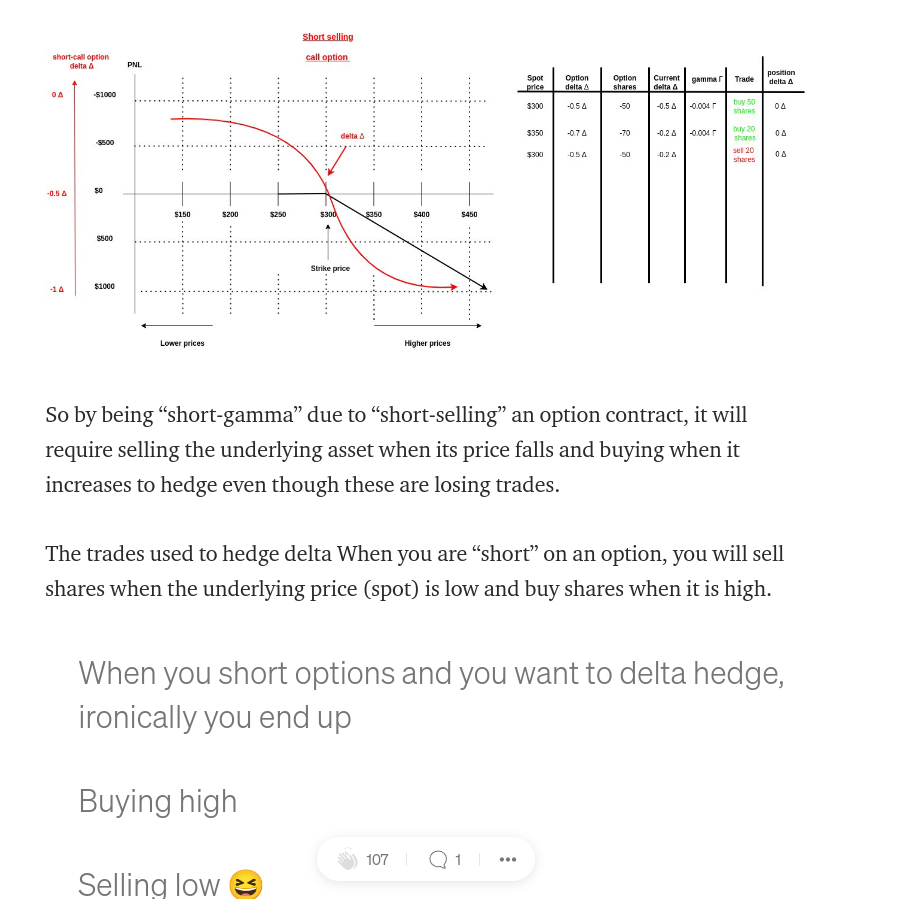
If you don't understand a word of what I just said, don't worry. I've written an article about being "short-gamma" and hedging
Full article:
https://romanornr.medium.com/options-trading-part-3-gamma-curvature-risk-9f6dd4b3db5b
QQQ
Despite the recent outperformance of the QQQs, a very high negative gamma slope indicates that a significant increase in volatility would accompany a move down.
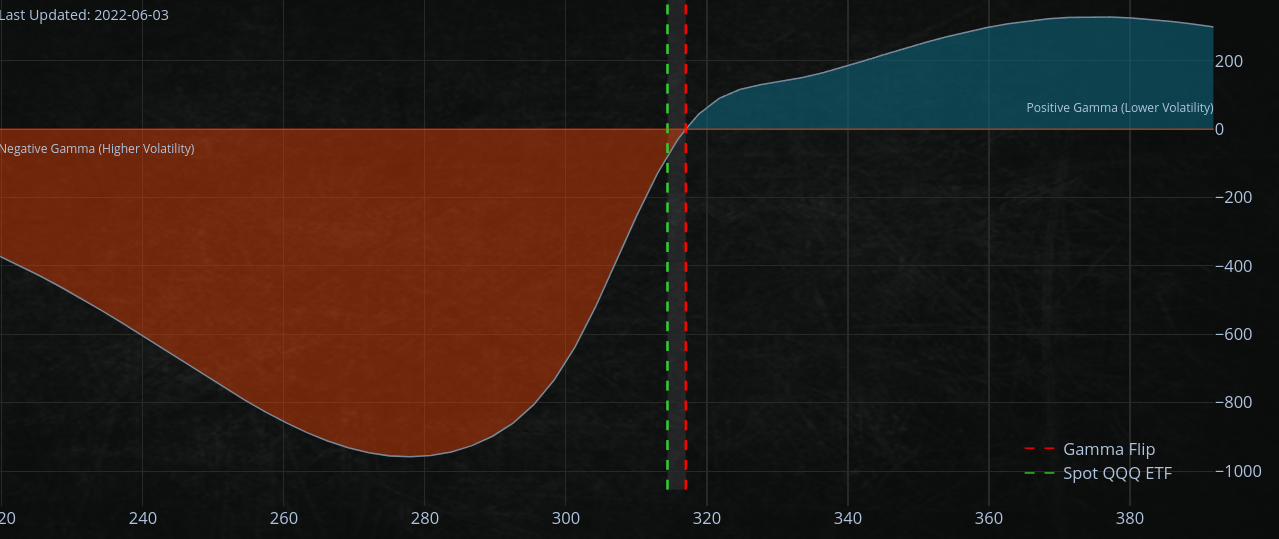
Gamma measures the rate of change of an option's delta in relation to the underlying asset's price.
A negative gamma slope suggests that the option's delta will decrease as the underlying asset's price decreases. That means that a move lower in the underlying asset's price would be accompanied by a volatility
OPEX, FOMC
The value of short-dated volatility (volatility over a short period of time) is diminishing, indicating that speculative "risk-on" behavior will be restrained. This is because the tailwind provided by options trading is moving.
Options-derived tailwind?
The options-derived tailwind is a positive force created by options trading. It happens when the price of an option rises faster than the underlying asset. That can happen when there is high demand for the option, as investors are willing to pay more for the right to buy or sell the asset at a set price.
JPMorgan collar put
There's a call wall on the SPX500 options market.
If the Call Wall moves up, our target for the upside also moves up.
Possibly $4300 area would be a potential (at best), but that's due to the large JPMorgan collar put strike $4285, which expires on June 30

A collar put strike?
A collar put strike is an options strategy used to protect profits on a stock that has been sold short. It involves buying a put option with a strike price below the current stock price and selling a call option with a strike price above the current stock price. That limits the potential upside and downside of the stock, allowing the investor to lock in profits.
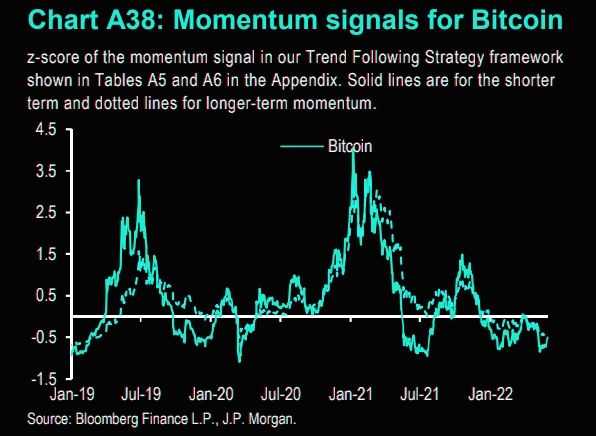
JP Morgan's trend following strategy's z-score for their Bitcoin momentum signal
The problem is that momentum is not moving in any direction.
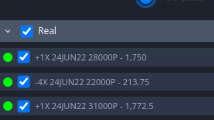
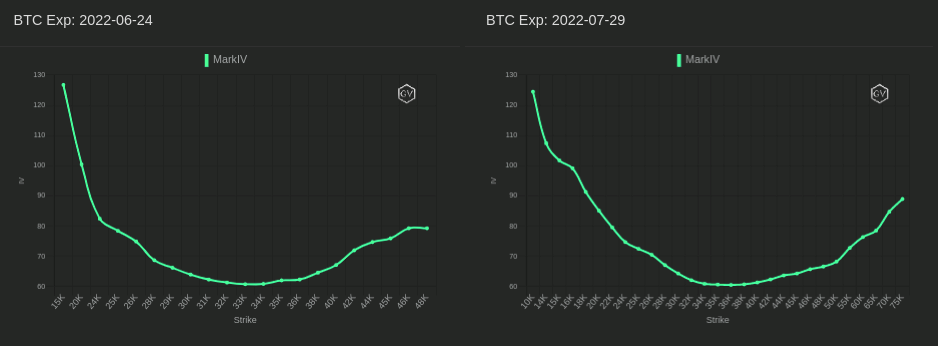
BTC Skew
Many "put options" have been bought around the $28k strike price. Many hedge funds probably feel the pressure of bitcoin possibly moving down even more, considering the macro.
Given the levels of "skew" on BTC and the front-end vol not realizing. That "put spreads" or "put ratio" option trades would be a better strategy.
Something like this as an option strategy would be better.
As I mentioned, I use mainly Deribit but playing around with Delta exchange and their tools
— Romano (@RNR_0) June 1, 2022
This options strategy is indeed a good hedge. Slightly in profit now (good risk/reward as hedge)
Only playing a bit on this exchange with small money to testhttps://t.co/qBPKvwB0Pj https://t.co/gA6dP91Xd0 pic.twitter.com/zkclBNe7Oi
However, BTC falling below $15k would hurt the position, and I'd be forced to hedge by shorting BTC-perp, but I don't think we would fall below $15k