Market Insight July 6, 2022
The first half of 2022 has passed and has been the worst start to equities markets in the last fifty years. What started in January as tax selling has turned into another horrible year but this time not only with a pandemic but also inflation, hostile monetary policies, war, the economic collapse of other countries, and starvation.
Currently, the markets face negative gamma circumstances, indicating a wide dispersion of strike prices in the options market. That is causing the market to range right now.
Uncertainty exists as to whether I should start reading this book "The Second Leg down."

or it's a bottoming process that will finally result in a more lasting rebound. (unlikely, but let's not rule it out some miracles)
That will mostly rely on events such as inflation, interest rates, war, and other macro events but also from inside the market, the flow of money within the market itself)
Some experts see a rise in risk due to retail flows, although it is still unclear if this is symptomatic of a bigger trend. no signs that the structural flows into retirement funds have started to shift (yet). If unemployment rises due to job losses, it could lead to the next leg down.
SPX500
The $3800 strike price is slowly becoming the center of a new regime. That means more and more trading is happening around the $3800 price point.
Expect markets to broadly consolidate around this strike price until economic outcomes become clearer to both markets and central bankers.
Expect markets to consolidate broadly until economic outcomes become more clear. Keep an eye on the $3800 level and any new economic developments that could provide more clarity to the market.
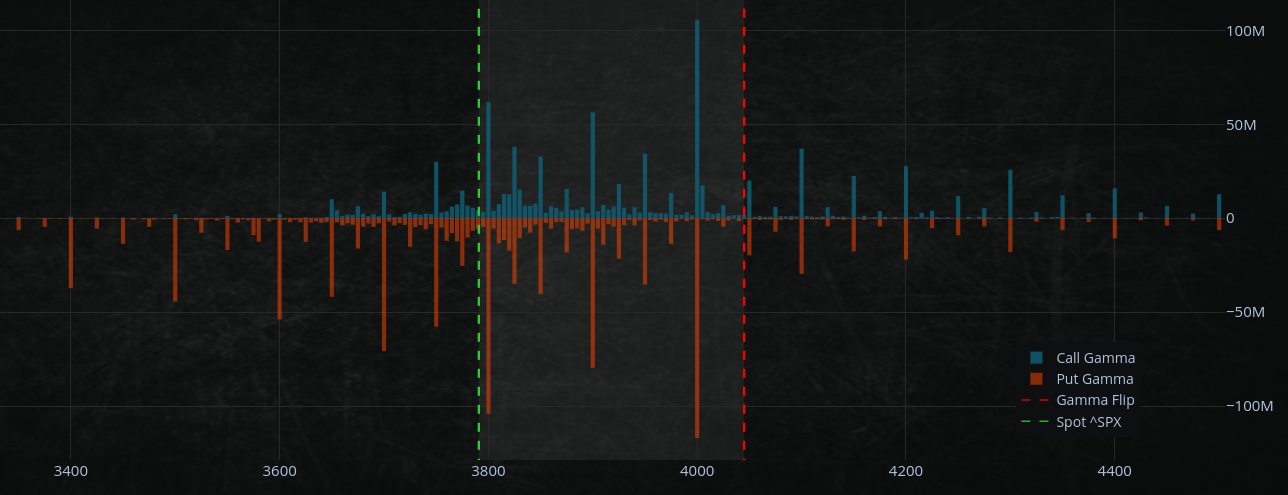
We have support at $3700 and resistance at around $3860.
After the massive June expirations, we have entered a new round, with options flows now related to
Once again, OPEX or OpEX stands for Option Expiration date
- July 15 OpEX.
- Equity OpEx arrives just before a VIX expiry on July 20.
- Followed by FOMC on July 27.
- Mid-July, earnings.
The $4000 strike price seems far away.
Expiration for "put option" fuel is the remaining energy in the options market utilized to shift markets. When this fuel degrades, less energy is available to move markets.
There are still substantial hedges on, by looking at the VIX.
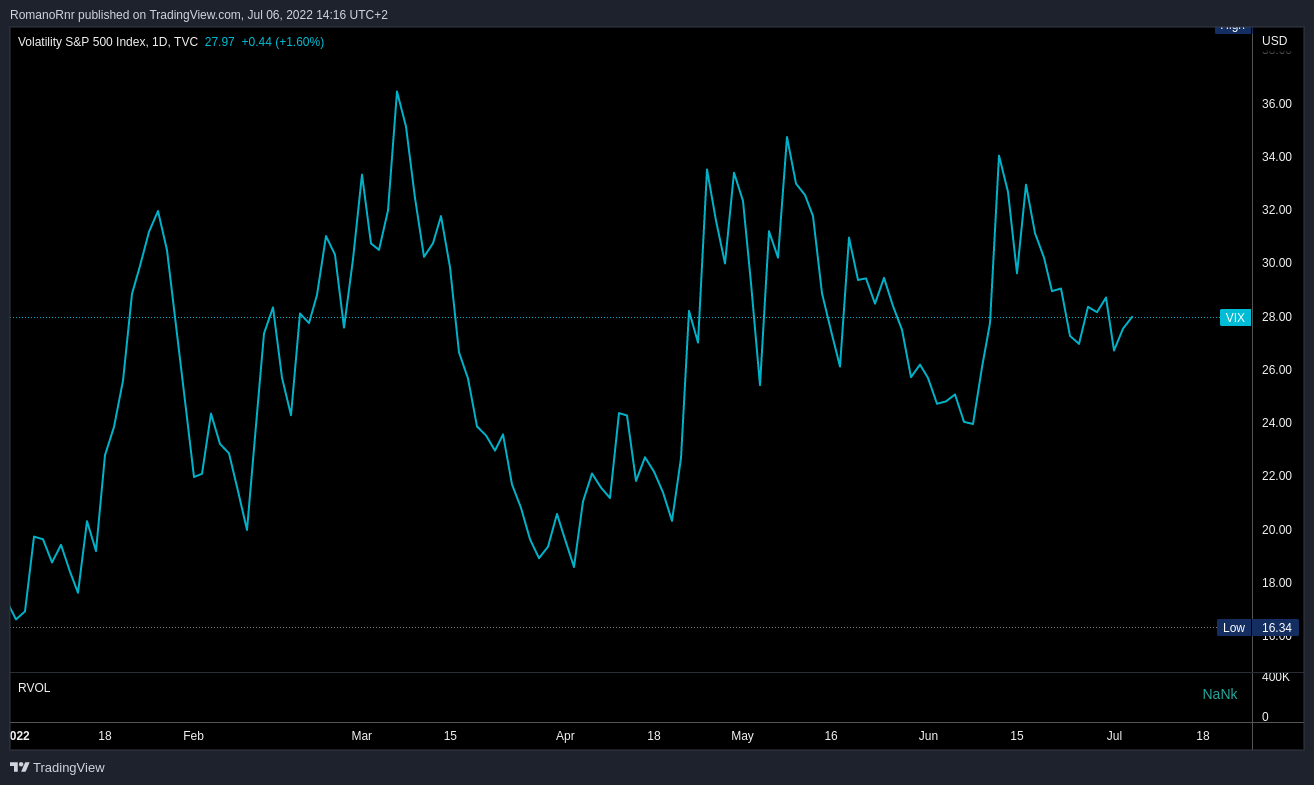
It's unlikely that most market participants will close their hedge positions before July 15th OpEX. That might indicate that there are still some hedges in place that might prevent the markets from becoming excessively volatile but that these hedges are unlikely to undergo significant adjustments until after the July 15th expiry of options.
In addition, from a macroeconomic standpoint, market participants will most likely maintain hedges through the FOMC meeting at the end of the month. That indicates that traders will maintain their hedges until the Federal Open Market Committee meets at the end of the month.
While we remain in a mild negative gamma zone (dealers must hedge in the current market direction), nothing compels a delta covering (indiscriminate buying via put hedge closing).
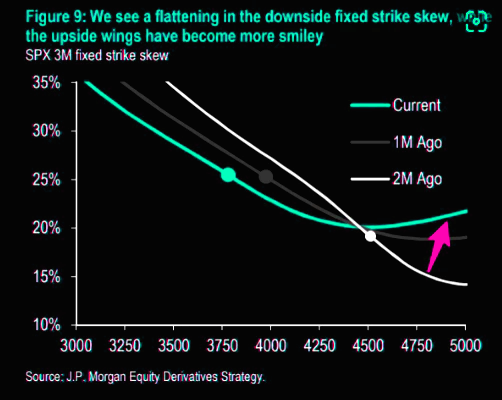
Skew is now less flat, suggesting fewer put selling and call buying.
What is skew?
The skew is the difference in implied volatility between out-of-the-money put options and out-of-the-money call options. A flat skew means that the two implied volatilities are the same, while a positive skew means that the out-of-the-money put options have higher implied volatility than the out-of-the-money call options.
That indicates that, although the market remains marginally favored to move in the direction that dealers are hedging (selling put options), there is no strong force pushing this move, and the market might continue to move sideways or perhaps slightly lower.
If we break below the $3700 "put wall", this will result in the rolling of put hedges to lower strike prices, which opens the doors for lower lows.
Currently, It makes more sense to buy volatility than to sell it. This is due to the fact that implied volatility (as measured by the VIX) is consistently rising while real volatility (as measured by the SPX) stays relatively low.
There is a lot of "delta decay" associated with options near expiration, which is one reason why it may make sense to buy volatility at this time. The "delta" measures the amount by which the price of an option changes in reaction to a change in the underlying asset. When an option is near expiry, its "delta" decays, which means its sensitivity to changes in the underlying asset decreases.
The currently depressed skew, especially among options with shorter maturities, is another incentive to buy volatility. Skew also measures the extent to which put options trade at a discount to call options. When skew is depressed, options are quite "cheap".
Charm decay is a measurement of how much the price of an option varies as a result of the passage of time. When an option is near to expiry, its charm decays, making it less sensitive to changes in time. If the SPX500 breaks above $3,800 combined with the high "charm decay" associated with options at this level.
However, as mentioned before, If we break below the $3700 "put wall," this will result in the rolling of put hedges to lower strike prices, opening the doors for lower lows.
Bitcoin
I tweeted this a couple of days ago but let's review this again.
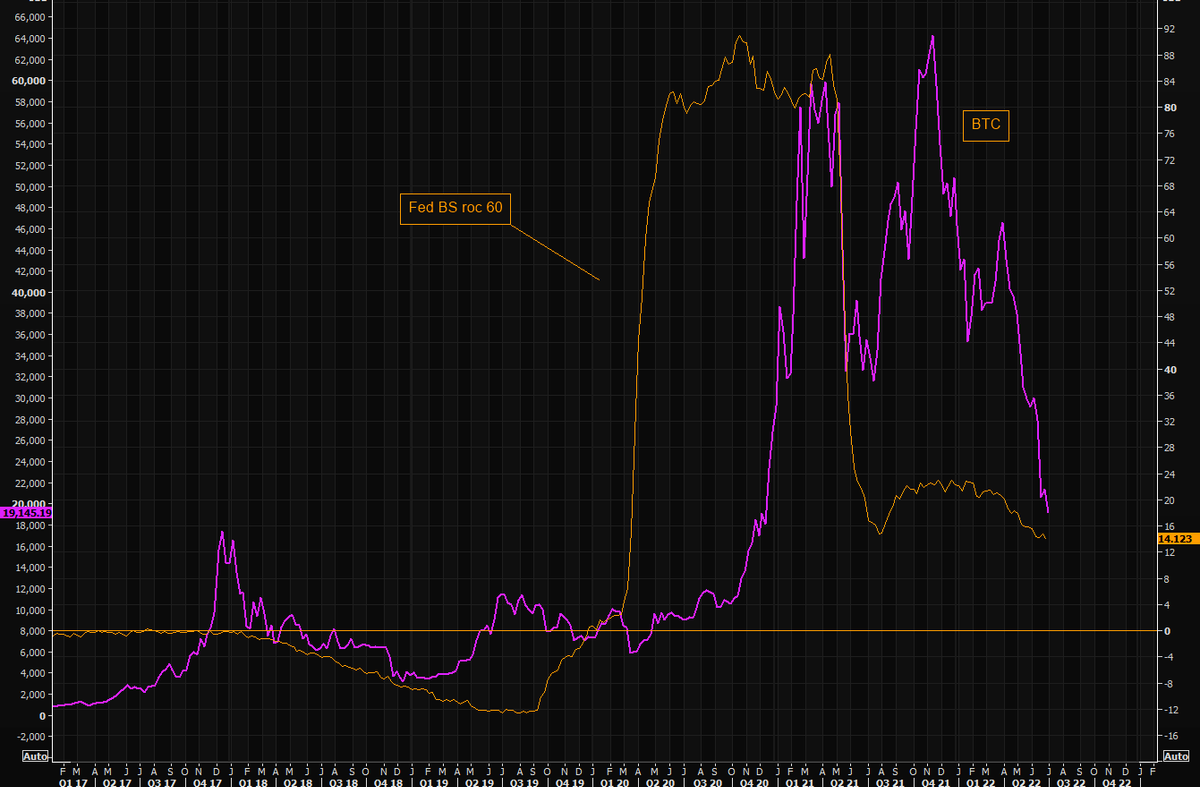
The Federal Reserve's balance sheet ROC60 (FED BS ROC60).
If I understand correctly, the "rate of change" in the value of the assets held by the Federal Reserve over a 60-day period.
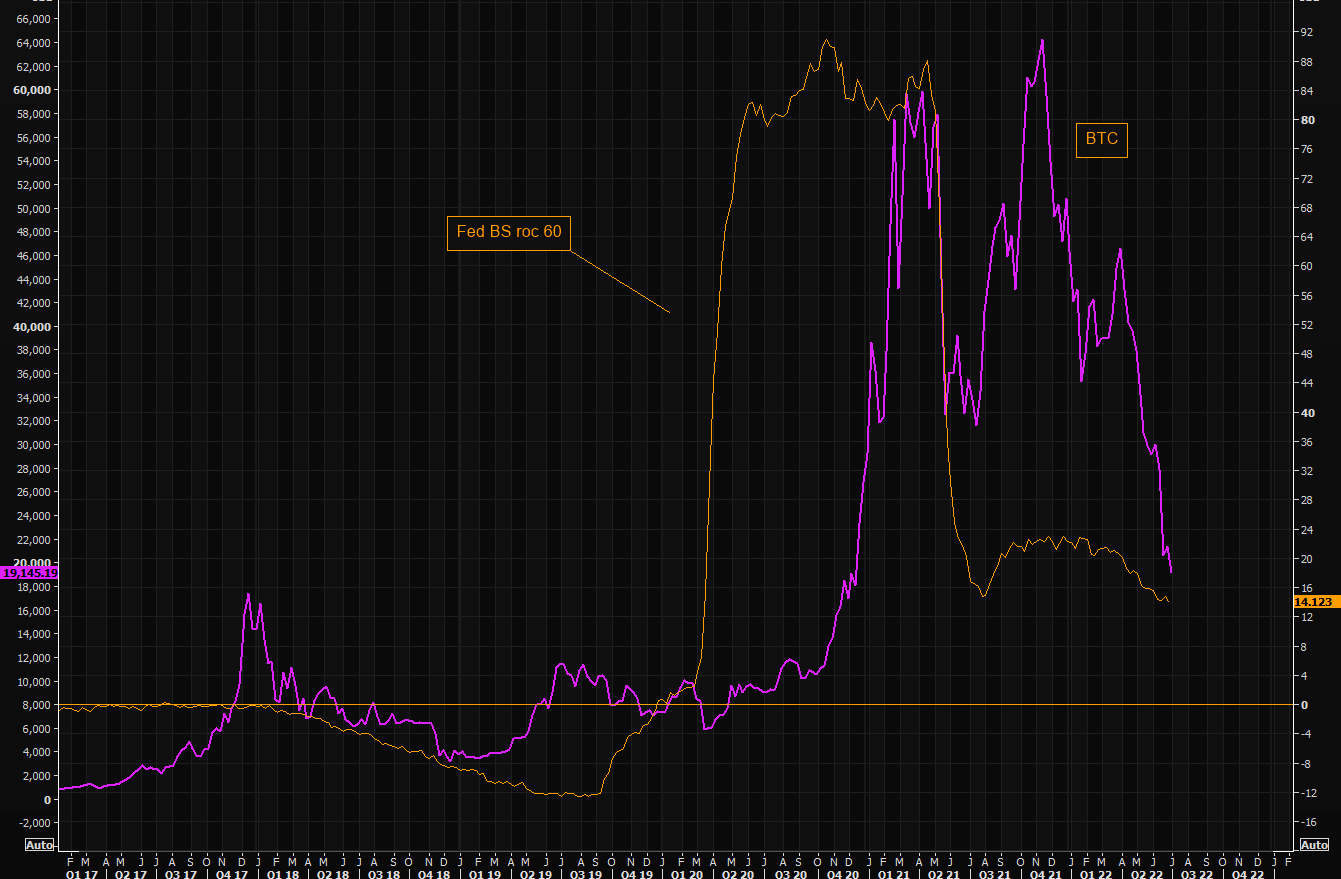
It's all about the price difference from one day to the next. Right now, the world's most important "delta" is the Federal Reserve's balance sheet. The Federal Reserve's balance sheet has been growing at an unprecedented rate.
The Federation Of Retarded Reptilians has been cranking up their money printer at an unprecedented rate since the COVID pandemic started. This has caused the value of the US dollar to decline, which has been good for bitcoin.
But the Fed's balance sheet has now rolled over, and things are less clear. Bitcoin may find some bottom soon, But it is also possible that the sell-off/unwinds will continue, but it's worth tracking the FED balance sheet vs. bitcoin.
Rolled over in this context, Federal Reserve's balance sheet means that they stopped increasing the size of its balance sheet. That could be because the economy is improving, and the Fed feels enough to prop up the equity market.
Or it could be because the Fed is worried about inflation and wants to start shrinking its balance sheet. Either way, the roll-over might mark a change in the Fed's policy, which could impact the price of bitcoin sooner or later.
Disclaimer: So far, from my understanding of the "rate of change" in the value of the assets held by the Federal Reserve over 60 days, as FED BS grew, the bitcoin price grew. Was this all even "organic growth" at all? Equity markets sure faced a reality check.
Sorry, I wanted to write more, but I have to visit the hospital due to family circumstances. I rushed writing this and probably left some mistakes here and there.