Market insight, July 30 2022

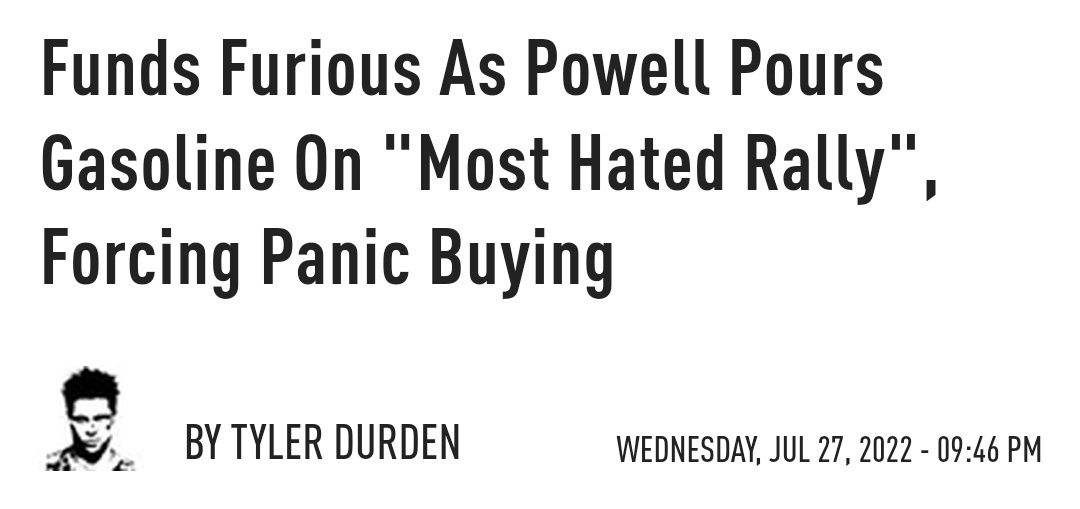
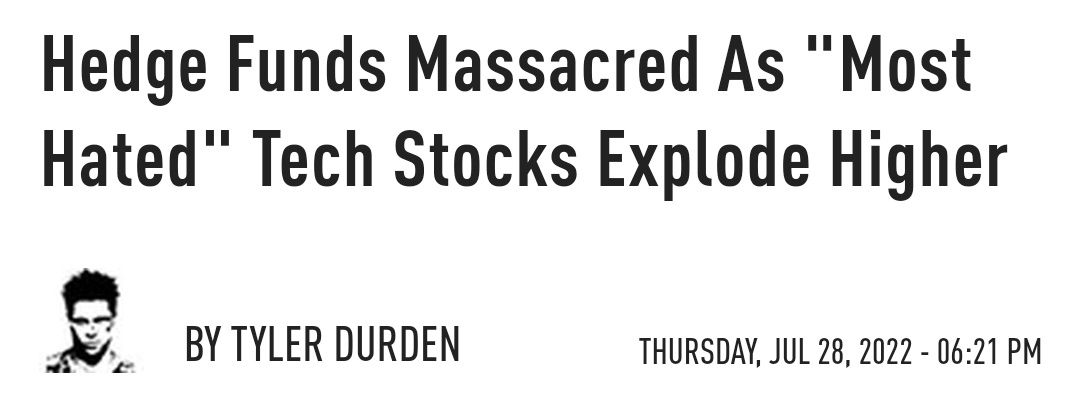
It seems that market participants were prematurely bearish in anticipation of the FOMC. A similar situation like in June. The market was potentially pricing in a worst-case scenario, and a 75bps would be "dovish" compared to the hypothetical 100bps hike. It caught many market participants off-guard, and the latest rally is one of the "most hated rallies."
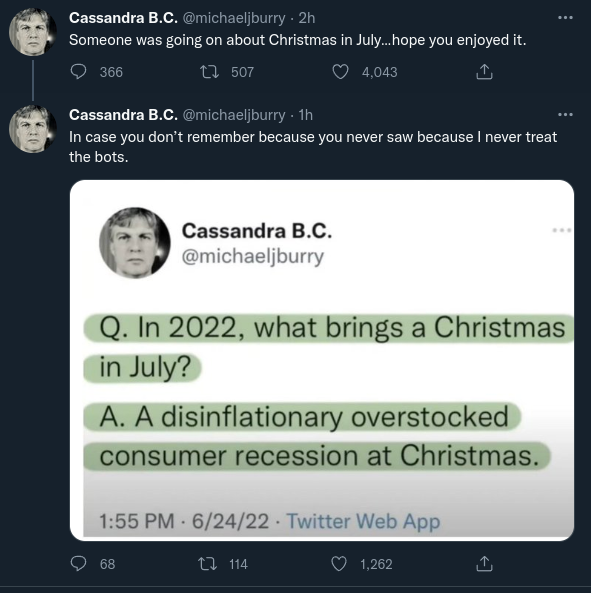
As we saw some headlines from Zerohedge
In conjunction with increases in the equities and commodities markets, bitcoin prices have increased by more than 10%. It is hard to foresee the pinnacle of the bear market rebound or to determine whether risk assets and/or equity markets have reached their bottom.
Bear market rallies tend to get bigger the more prolonged the bear market continues, so we could see a significant rally at some point.
However, it's important to remember that we are still in a bear market, and the magnitude of the fourth squeeze in bear markets between 2002 and 2008 was 21% and 19%, respectively.
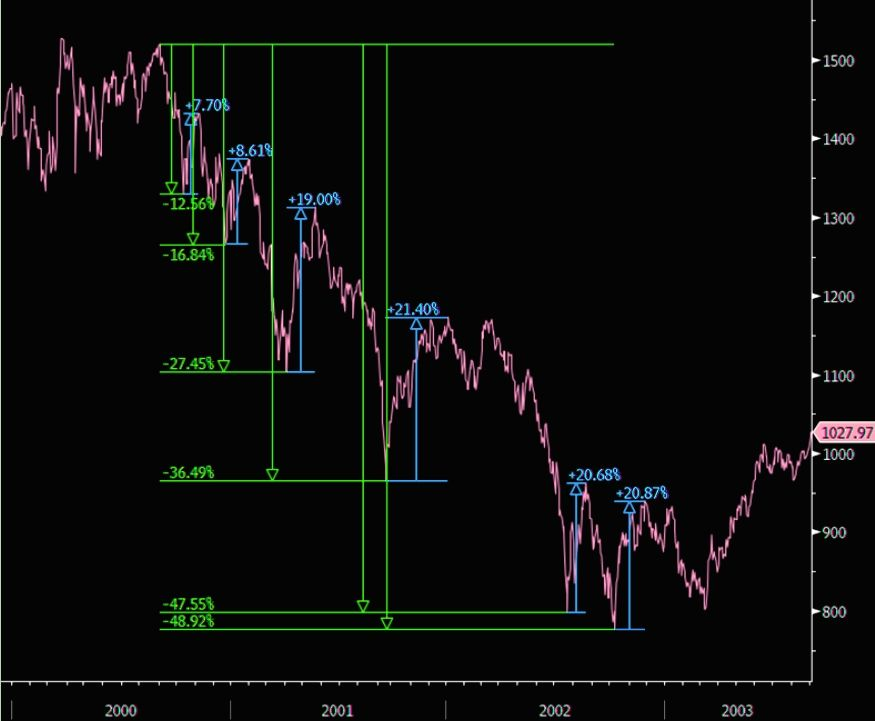
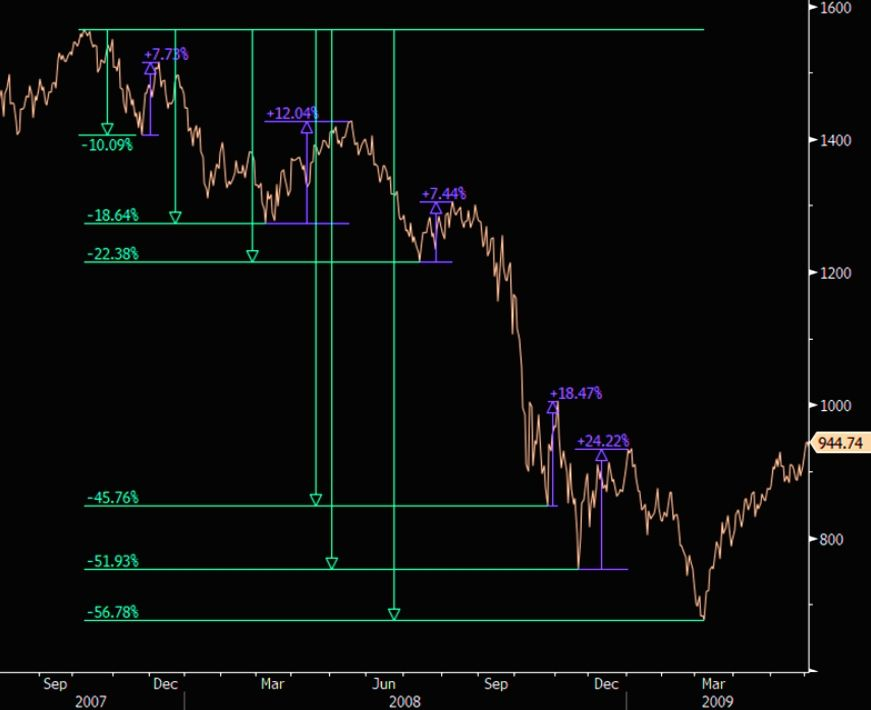
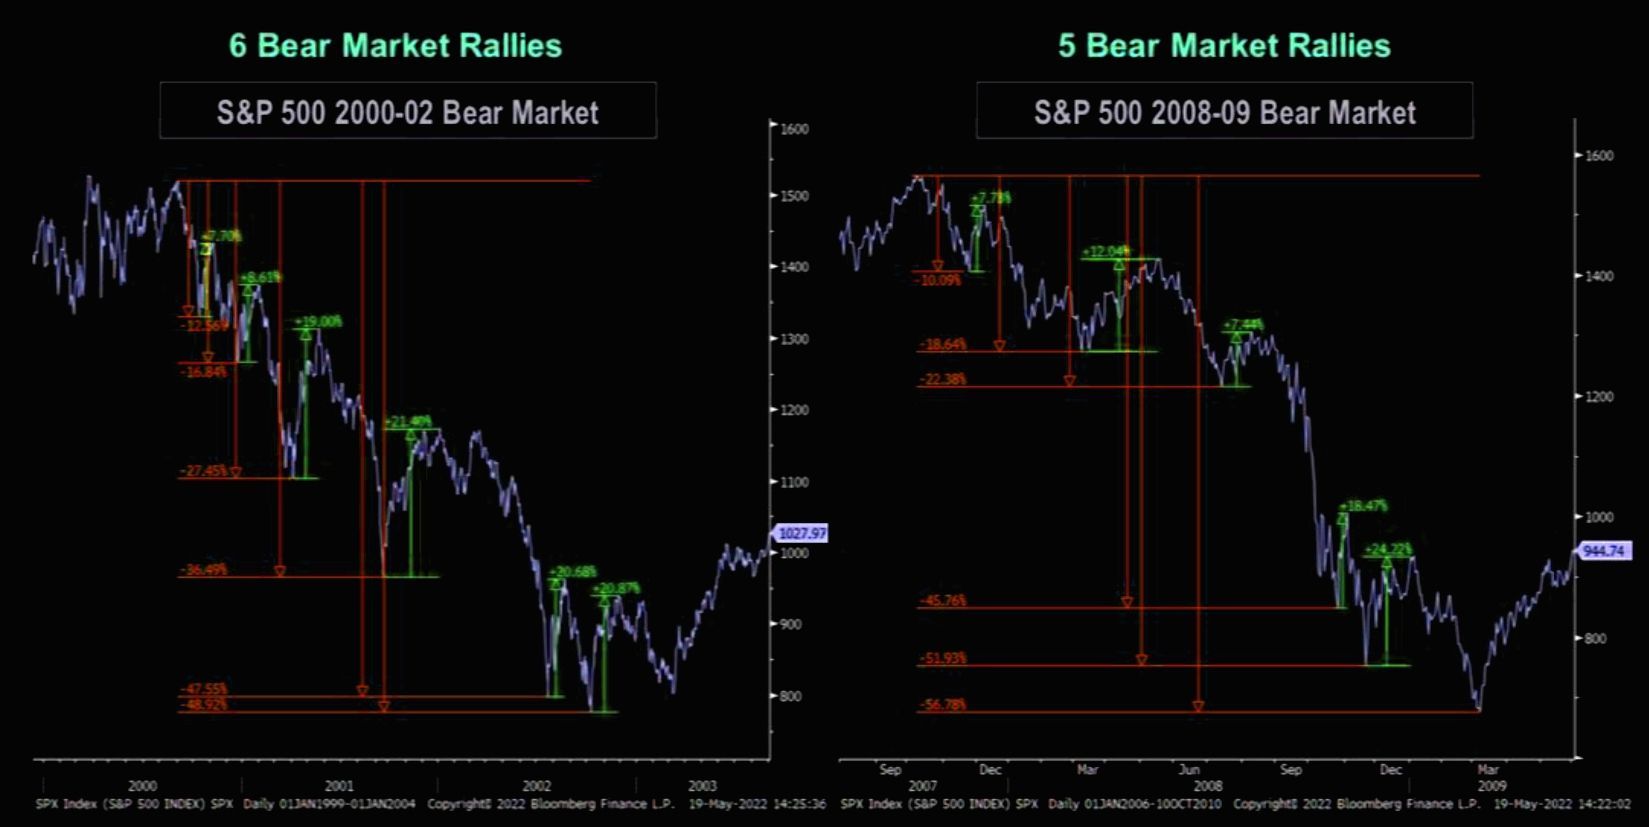
Falling prices and pessimism characterize bear markets among investors. Nevertheless, even in a bear market, there will be periods of rising prices, known as bear market rallies.
Bear market rallies tend to become more remarkable as the bear market gets deeper and older. That is because as a bear market unfolds, investors grow more eager for any evidence of a recovery and are prepared to pay ever-increasing prices for assets they hope will return.
Eventually, the bear market will end, and prices will continue to climb continuously.
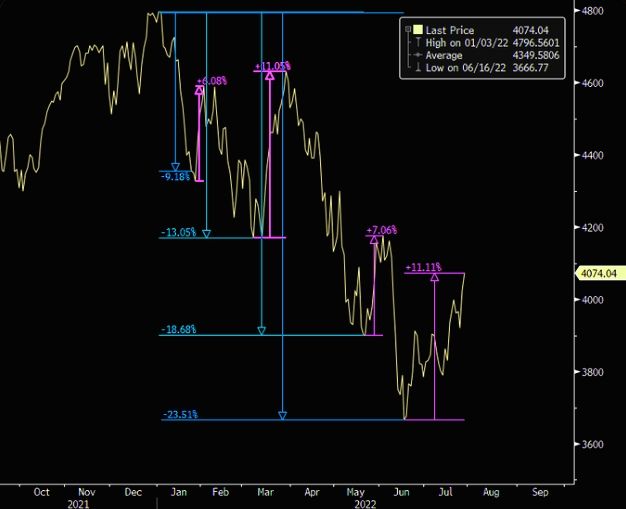
We don't know if the bottom is truly in. From a macro view, most likely not, but let's keep our options open and continue monitoring.
2022 July and this is now the fourth rally within this bear market.
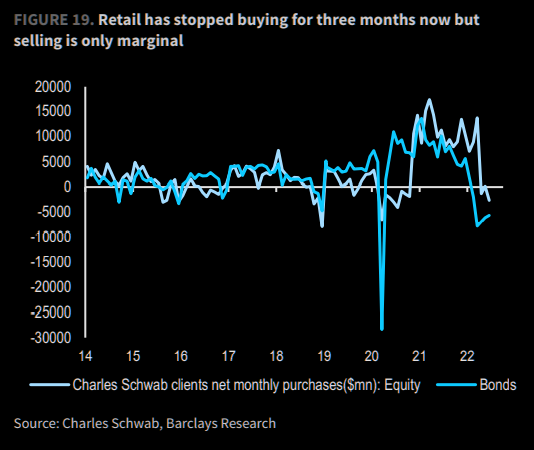
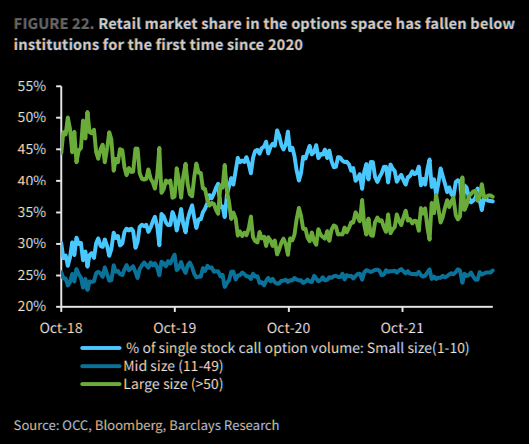
Retail army
Retail investors have learned this lesson the hard way since buying has slowed considerably over the previous three months. Indicating that retail investors are less interested in options, options trading activity has continued to decline. Since the beginning of 2020, this is the lowest market share of retail investors on options exchanges.
Theta measures the time decay of an option's value. Theta represents the amount by which the value of an option declines every day as it approaches expiration.
In practical terms, this indicates that options tend to lose value as their expiration date approaches.
They may have been stopped in the options market but.....
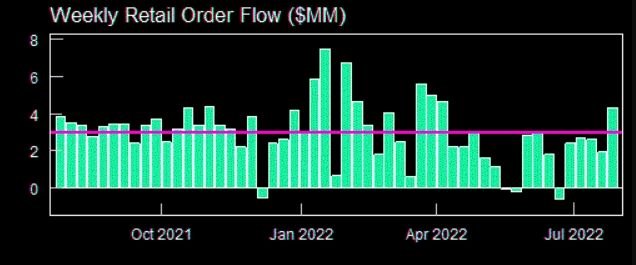
Retail Army returning in full force
This week's net cash equity purchases by retail investors were $4.3 billion, or 0.8 standard deviations above the one-year average. That is the first time since early that weekly retail net sales have topped the yearly average.
That indicates that retail traders (individual investors) have returned to the market in force. They net bought cash equities worth $4.3 billion, 0.8 standard deviations over the one-year average. That is the first time since the beginning of the year that retail net buying has topped the yearly average.
That indicates that retail investors are optimistic about the market and eager to reinvest more capital.
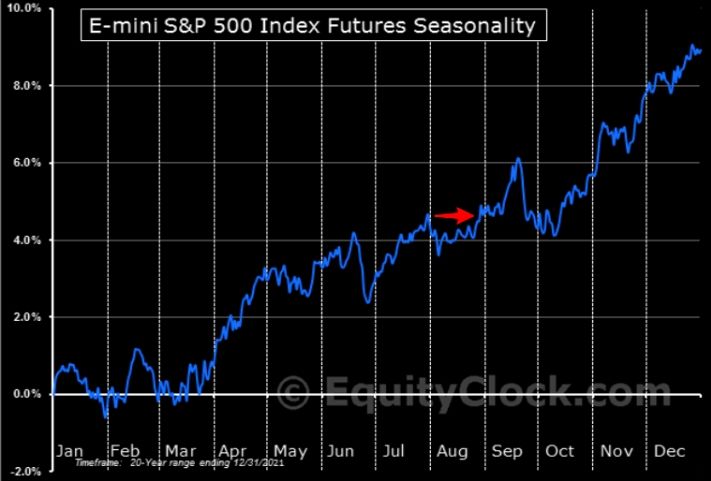
Seasonality
Seasonality is when investors expect that a certain action or event will occur at a particular time of year based on historical data. Based on the historical trend of prices fluctuating in late June and early July, perhaps there's room for more?
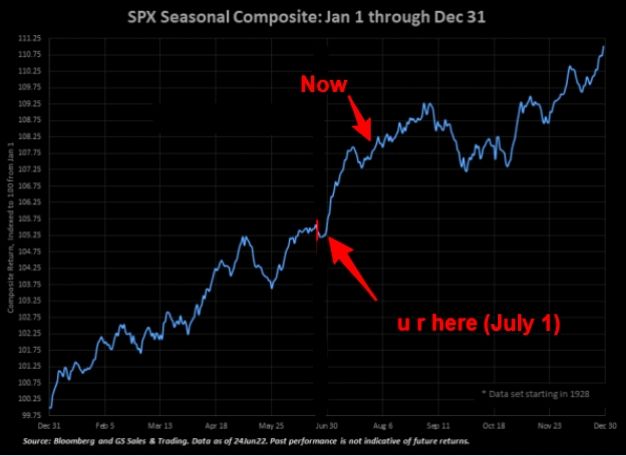
However, this might be against Michael Burry Bull Whip's theory.
US 10-year Treasury note & 10-year Treasury inflation breakevens
The yield on the 10-year Treasury note is a measure of the interest rate that the US government pays to borrow money for 10 years.
The US breakeven rates, the difference in yield between inflation protect debt and nominal debt of the same maturity. The US breakeven takes a forward look at inflation as opposed to CPI which is looking back.
If I'm correct, to be more specific... The 10-year break evens is the difference between the yield on 10-year Treasury bonds and the yield on 10-year Treasury inflation-protected securities. This difference is a measure of investor expectations for inflation over the next 10 years
When the yield on the 10-year Treasury note rises, it indicates that investors are expecting interest rates to rise in the future. When the yield on 10-year TIPS rises, it indicates that investors are expecting inflation to pick up in the future
When the yield on the 10-year Treasury note falls, the US government will have to pay less interest on its debt.
However, traders become more worried about inflation when the break-even rate rises. That is because the yield on TIPS bonds is rising relative to the yield on regular Treasury bonds.
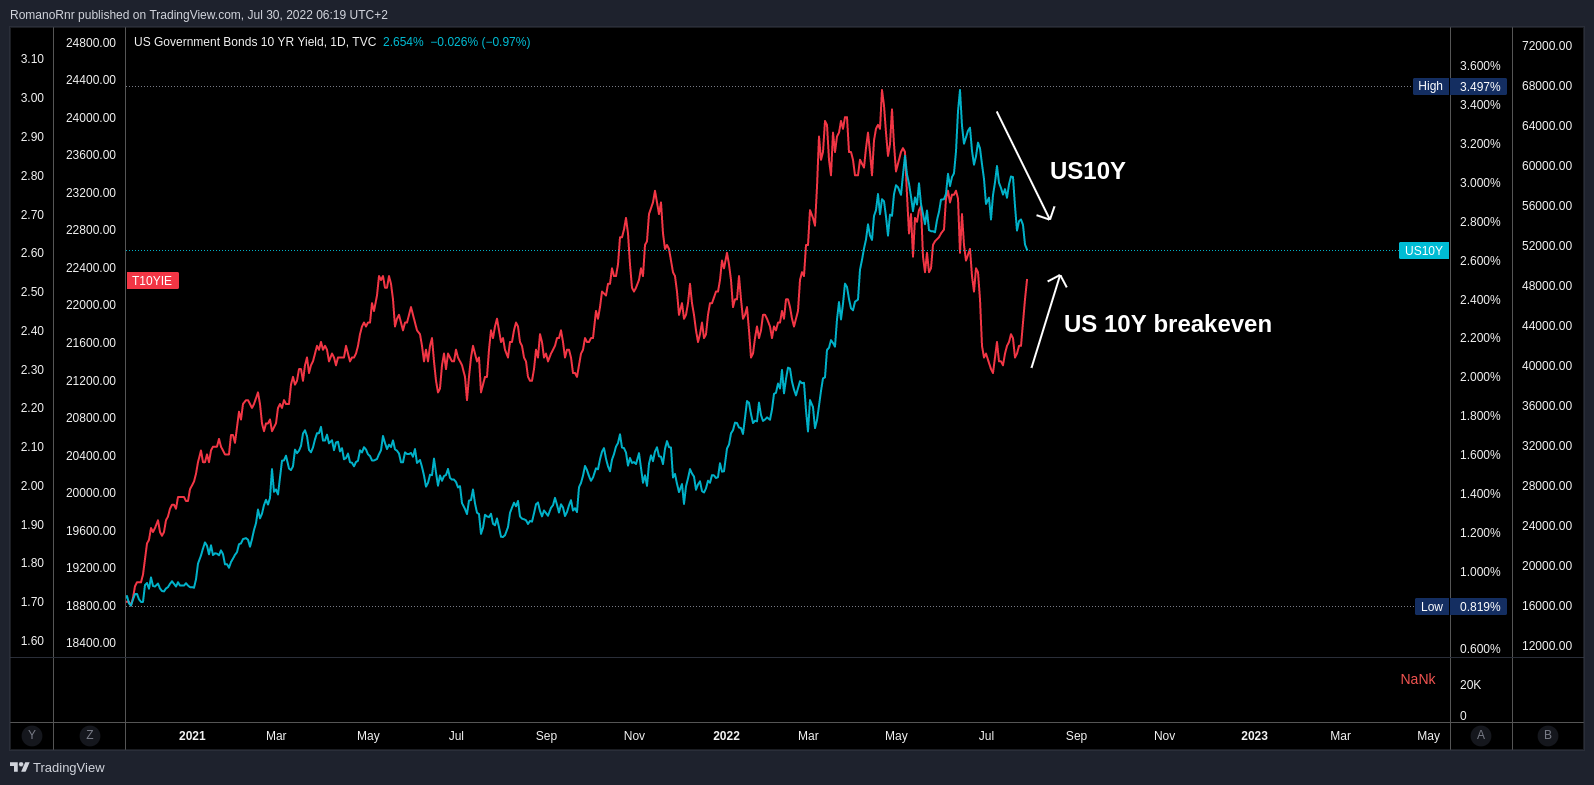
I'm not entirely sure if this is good for risk assets or not. Historically, rising US10Y has been accompanied by crypto bear markets. However, it seems to be going down. However, this is a very difficult macro environment.
The next CPI (Consumer Price Index) update will be on August 10.
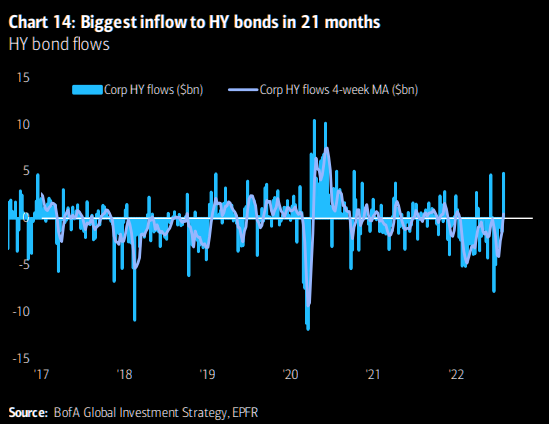
The HYG ETF is an exchange-traded fund that tracks the performance of high-yield corporate bonds.
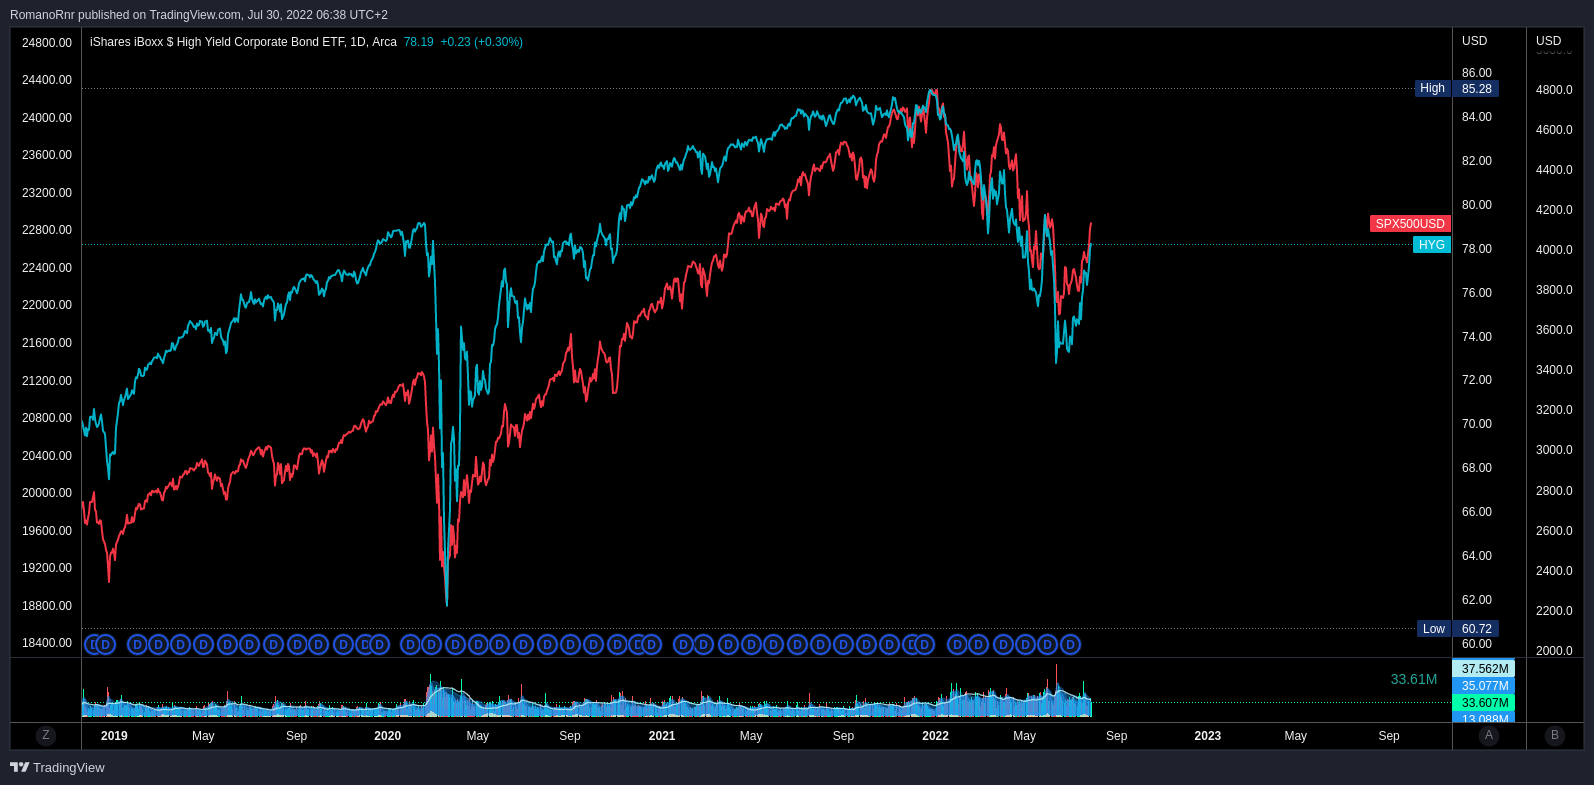
HY bonds are high-yield corporate bonds. The recent inflow to HY bonds is the biggest inflow in 21 months. This is significant because it shows that investors are starting to move back into this asset class after a period of avoidance.
The inflow to HY bonds indicates that investors are starting to feel more confident about taking on more risk. They are riskier than other types of bonds, so they typically have higher yields. Could be a sign that the markets are starting to turn around after a period of volatility?
Bitcoin
According to this analyst, the NASDAQ is back to where it was before the sell-off in mid-June, but BTC is still lagging.
The NASDAQ has returned to where it was before the sell-off in mid-June, but BTC is still behind.
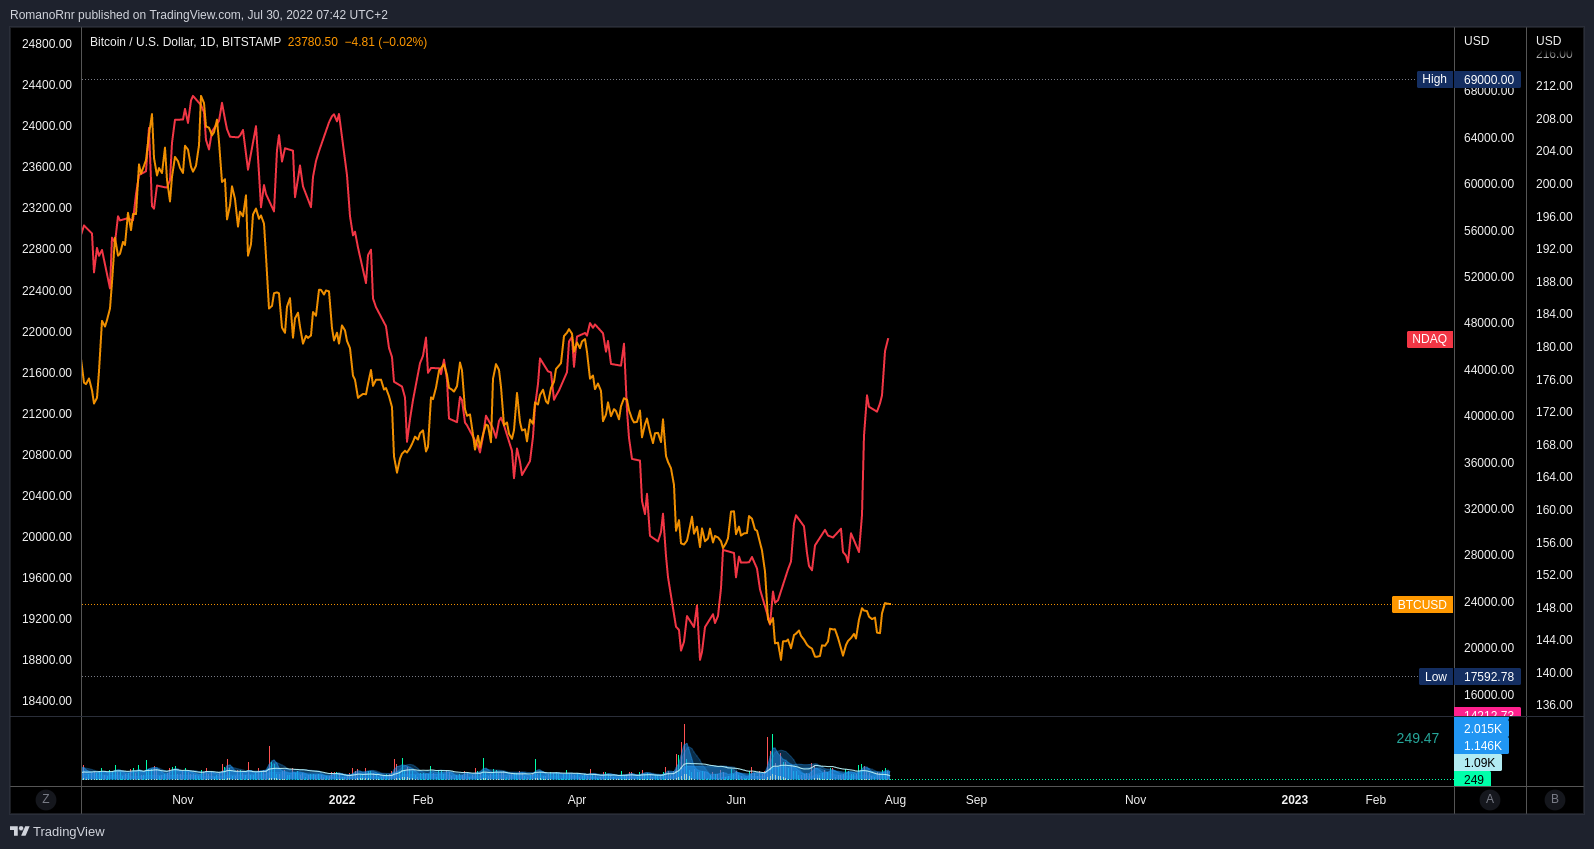
The correlation between these two assets is not as strong as it once was, but if BTC begins to close the gap, "call spreads" might be useful to profit from this trade.
Call spreads are a type of options strategy where you buy a call option and sell a call option at a higher strike price to minimize your risk. The advantage of using a call spread is that your maximum loss is limited.
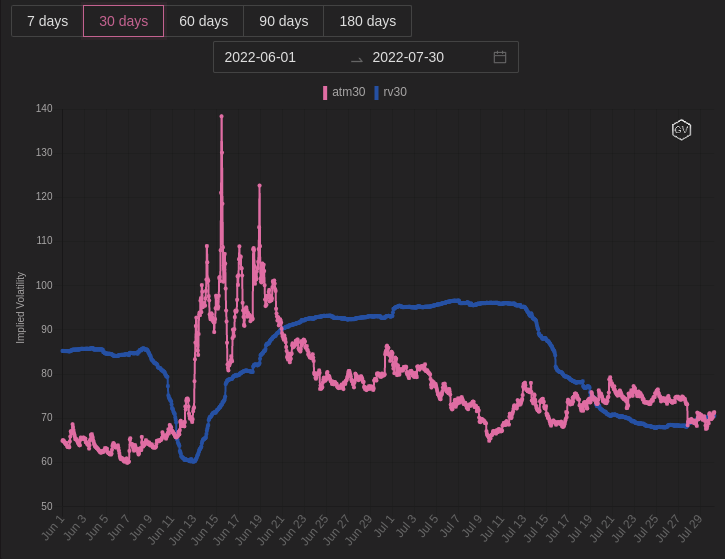
Volatility has been coming down recently. This chart shows the 1-month implied volatility (a measure of how volatile the market expects the actual volatility to be) compared to the realized volatility (a measure of how volatile the market actually was in the past month).
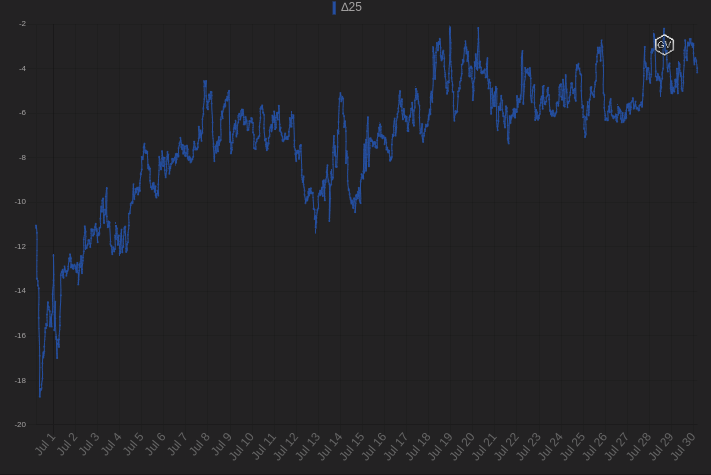
Call spreads are not too expensive because skew has increased.
Skew is the difference in implied volatility between out-of-the-money options and at-the-money options.
The 1-month 25 delta skew, which is the difference in implied volatility between options that are 25 delta (which means they have a 25% chance of being in the money at expiration) out-of-the-money and at-the-money options.
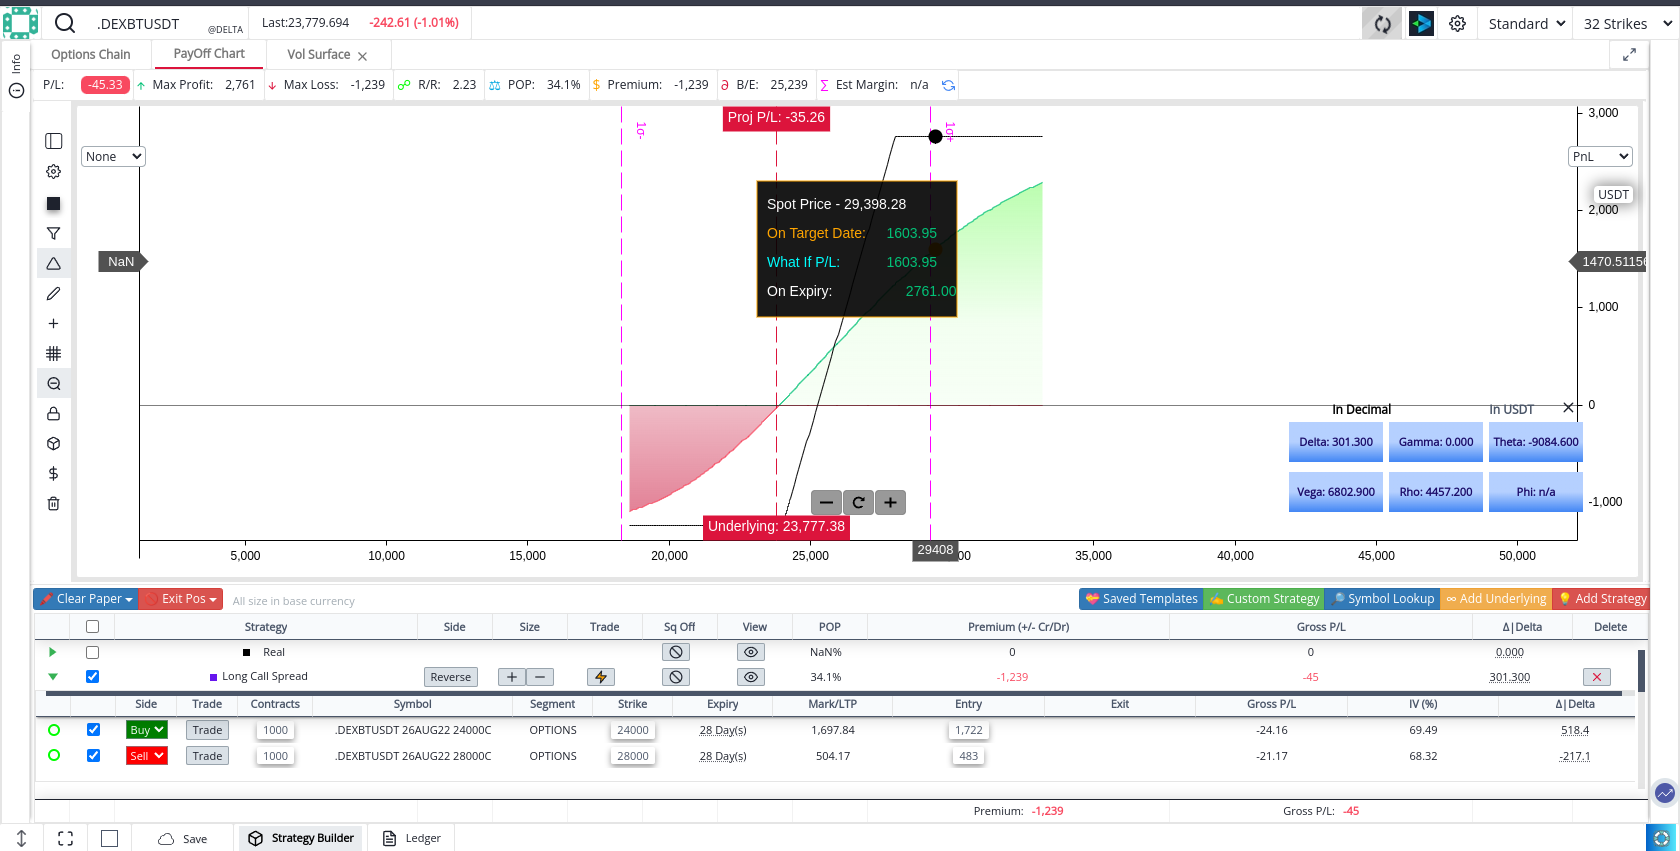
Possible plays
Buy call option at a strike price of $24k
Sell a call option at a strike price of $40k (if your limit order gets filled)
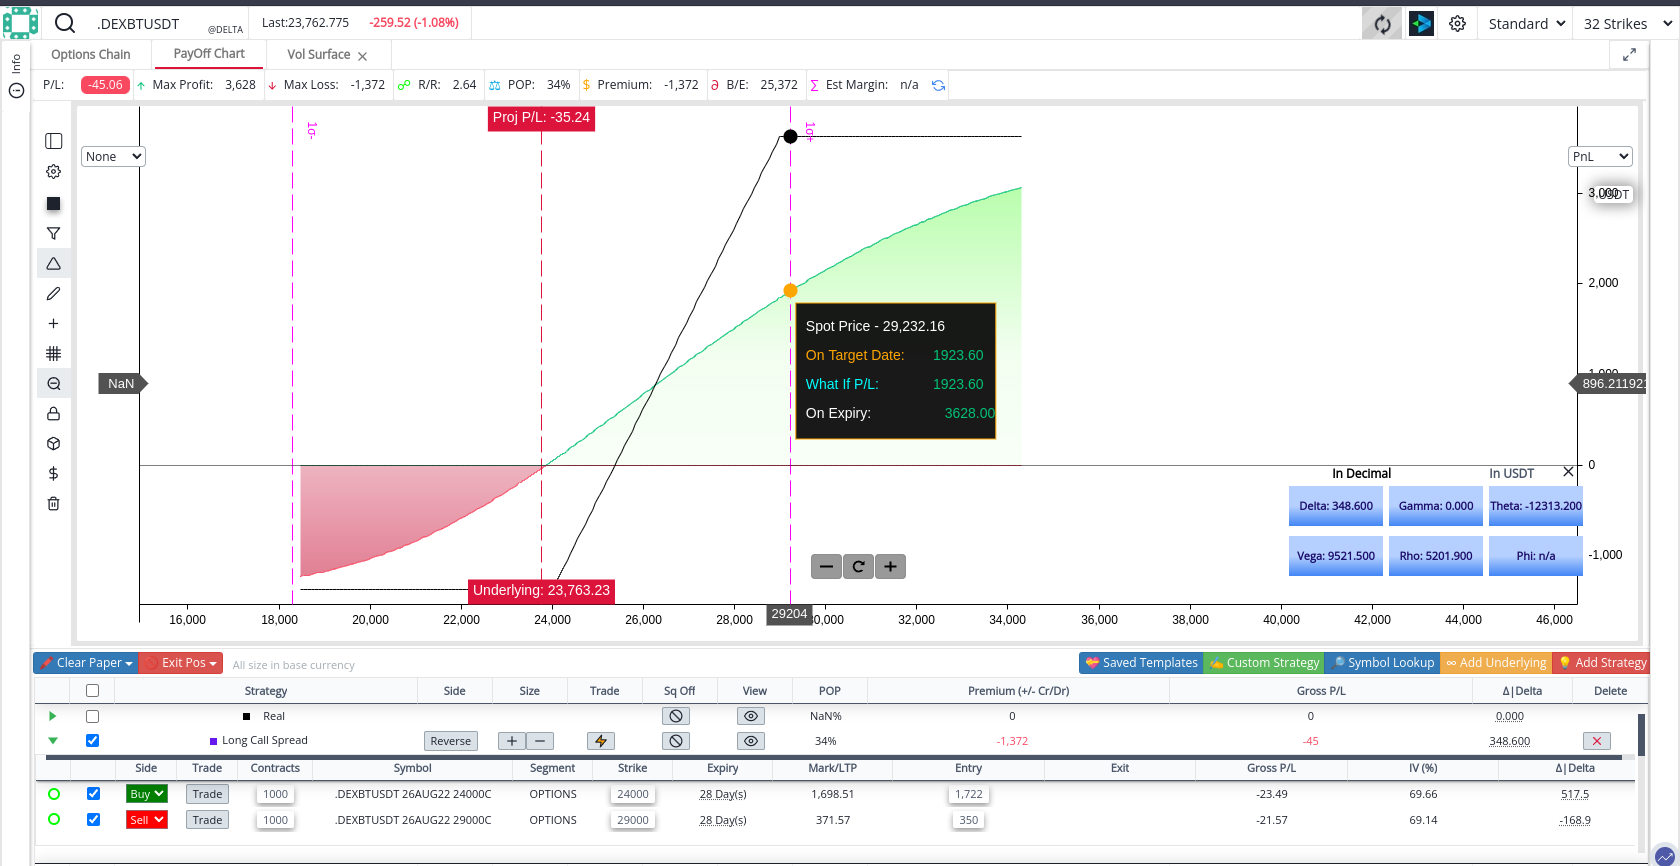
The other play would be
Buy call option at a strike price of $24k
Sell a call option at a strike price of $30k
For anyone who doesn't know which exchange this is, it's delta exchange, if you need a discount on fees: https://www.delta.exchange/?code=rnr
SPX500
it's important to see if traders can maintain high levels of open interest (i.e. the number of outstanding contracts) at higher option strikes (i.e. the prices at which options can be exercised). If they can, it suggests that the market has further to rally .
The way options are priced generally implies that when the market is going up, puts will become more expensive and calls will become less expensive. The opposite happens when the market is going down.
That has to do with implied volatility, which measures how much people expect prices to fluctuate in the future. When the market is going up, option sellers will buy protection in the form of puts because they anticipate that prices could fall in the future and they want to be hedged against this possibility.
Similarly, when the market is going down, option sellers will buy protection in the form of calls because they expect prices to rise in the future and want to be hedged against this possibility. By buying put or call protection, option sellers are effectively reducing their exposure to potential price movements, reducing realized volatility and making it more likely that prices will continue rising (or falling).
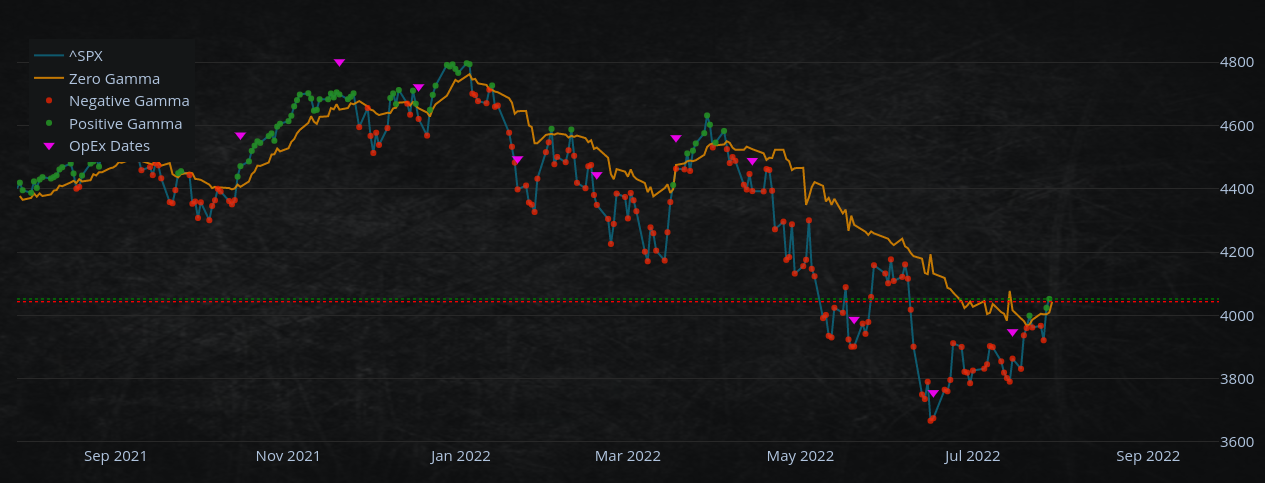
There's a call wall on the SPX500 at $4100
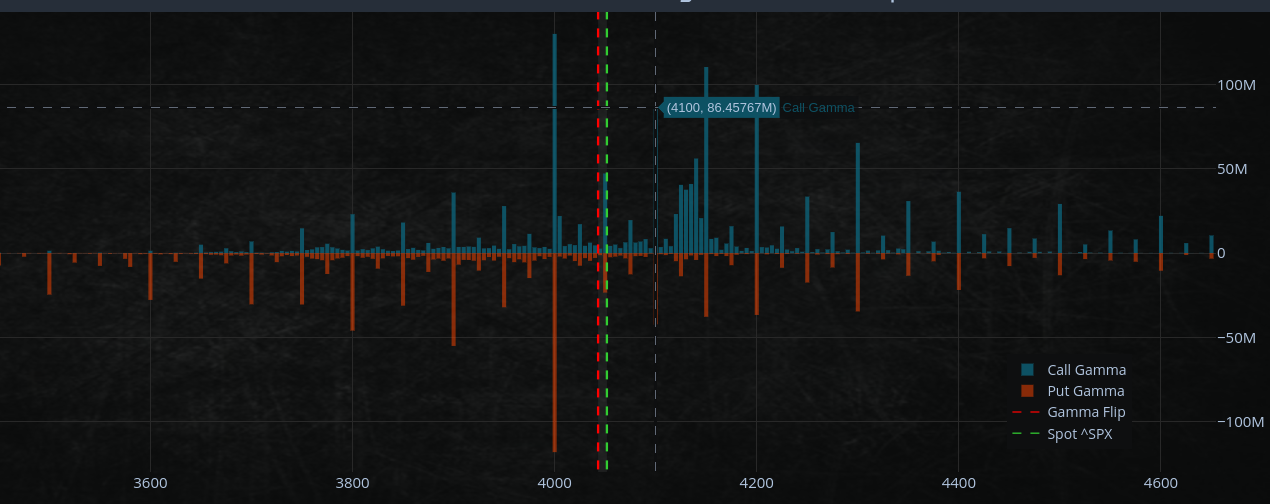
The "Call Wall" refers to the large number of outstanding call options (options to buy the underlying asset at a set price) that exist for the S&P 500.
If there is no aggressive buying pressure after Monday for these call options, it is likely the SPX500 will fall. A lack of demand will result in lower prices. This could signify a short-term local top in the S&P 500 index, as investors may lose market confidence.
Most likely the latest rally has been driven due to dealers, liquidity providers, and firms who provide liquidity to the market, positioning themselves in anticipation of lower levels of market volatility (also volatility compression). Since volatility is already relatively low, any further reduction will not likely have a major impact on prices.
Volatility compression refers to a situation where volatility (measured as the standard deviation of asset prices) falls to very low levels. That can happen due to several factors, such as an increase in central bank asset purchases or a shift in investor sentiment. When volatility is compressed, it means that there is less potential for price movements (up or down) and that returns are more predictable.
We have been moving again in positive gamma territory.
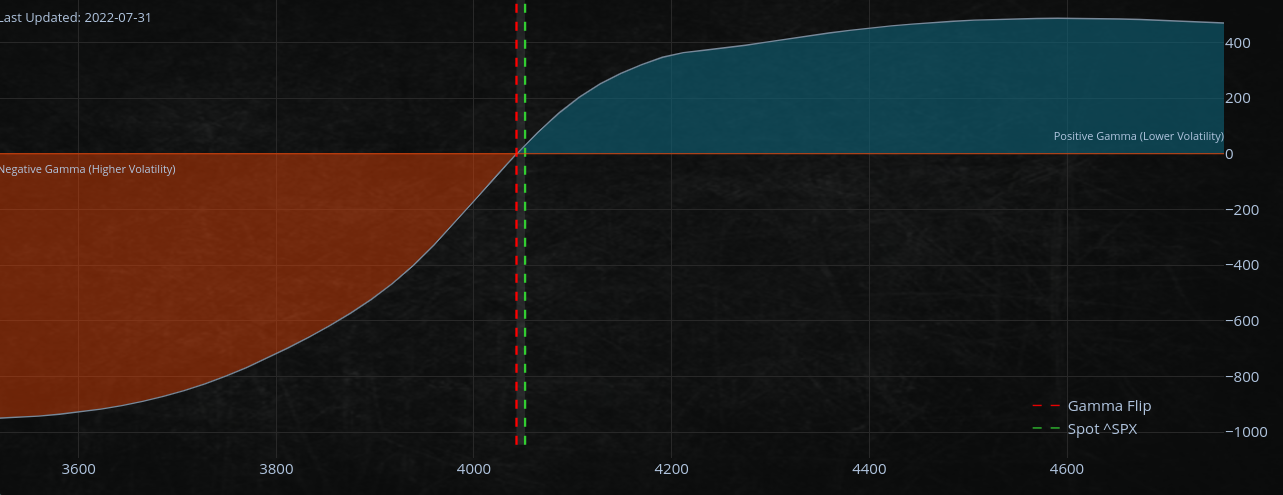
Fresh reminder about Gamma
Gamma is a measure of the rate of change of an option's delta in relation to changes in the underlying asset's price.
Positive gamma indicates that an option's delta will increase when the price of the underlying asset rises.
This is now occurring with the SPX500; as the market rises, the options become further "in-the-money."
Therefore, their delta (which measures the sensitivity of the options to changes in the underlying asset's price) is increasing.
The fact that dealers are becoming increasingly long deltas means they are taking on more and more risk as the market moves higher. However, they are still selling deltas - which means they are still hedging their positions against a potential drop in the market. That means they expect the market to move higher in the short term but are still wary of potential downside in the long term.
We had 2 days of positive gamma in a row. We've been in a negative gamma regime for a while.
"Druglike" web3
Martin Shkreli made an announcement yesterday His new company "Druglike" Web3 drug discovery software platform aim to eliminate obstacles to early-stage drug discovery.

Ethereum merge trade
The Ethereum protocol merge refers to the planned upgrade to the Ethereum network. This upgrade will see the Ethereum network move from a proof-of-work (PoW) consensus model to a proof-of-stake (PoS) consensus model. As a result, miners will no longer be able to earn rewards for verifying transactions on the Ethereum network.
It is important to monitor where the hashing power goes after the protocol merge because if one of the resulting blockchains or apps becomes the preferred destination for miners who have left Ethereum, the demand for the tokens associated with that project may rise. This is because the displaced miners will still need to earn rewards for their work and will likely go to whichever blockchain or app offers the most attractive rewards.
It could have implications for investments in the Ethereum network and projects built on Ethereum. If the demand for tokens associated with a particular project rises, the price of those tokens is also likely to rise. You would want to be aware of any developments that could cause the demand for Ethereum-based tokens to increase.
You may want to keep an eye on projects such as
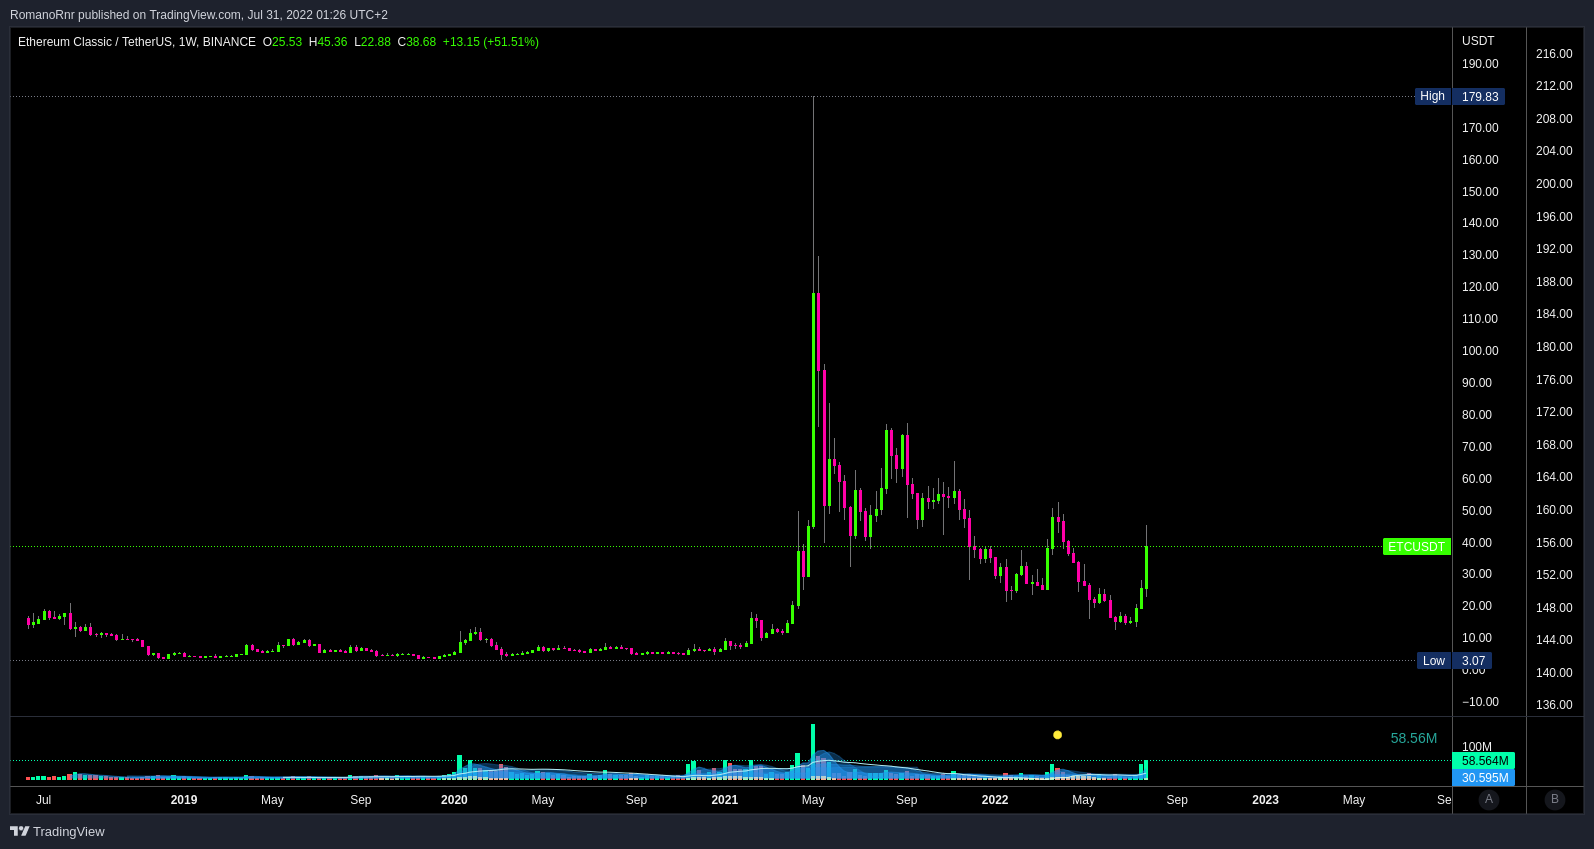
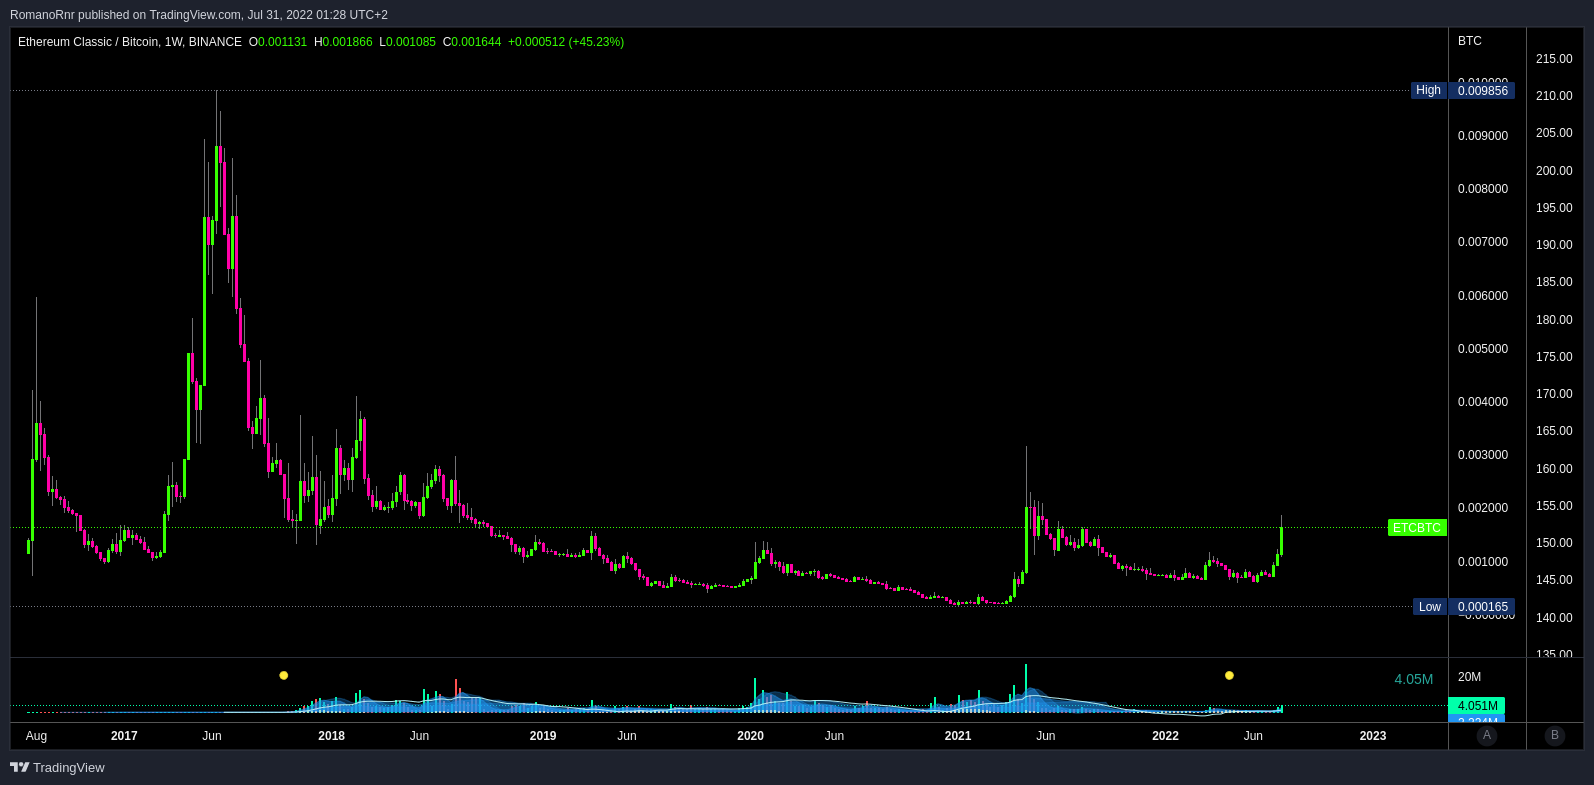
- Ethereum Classic
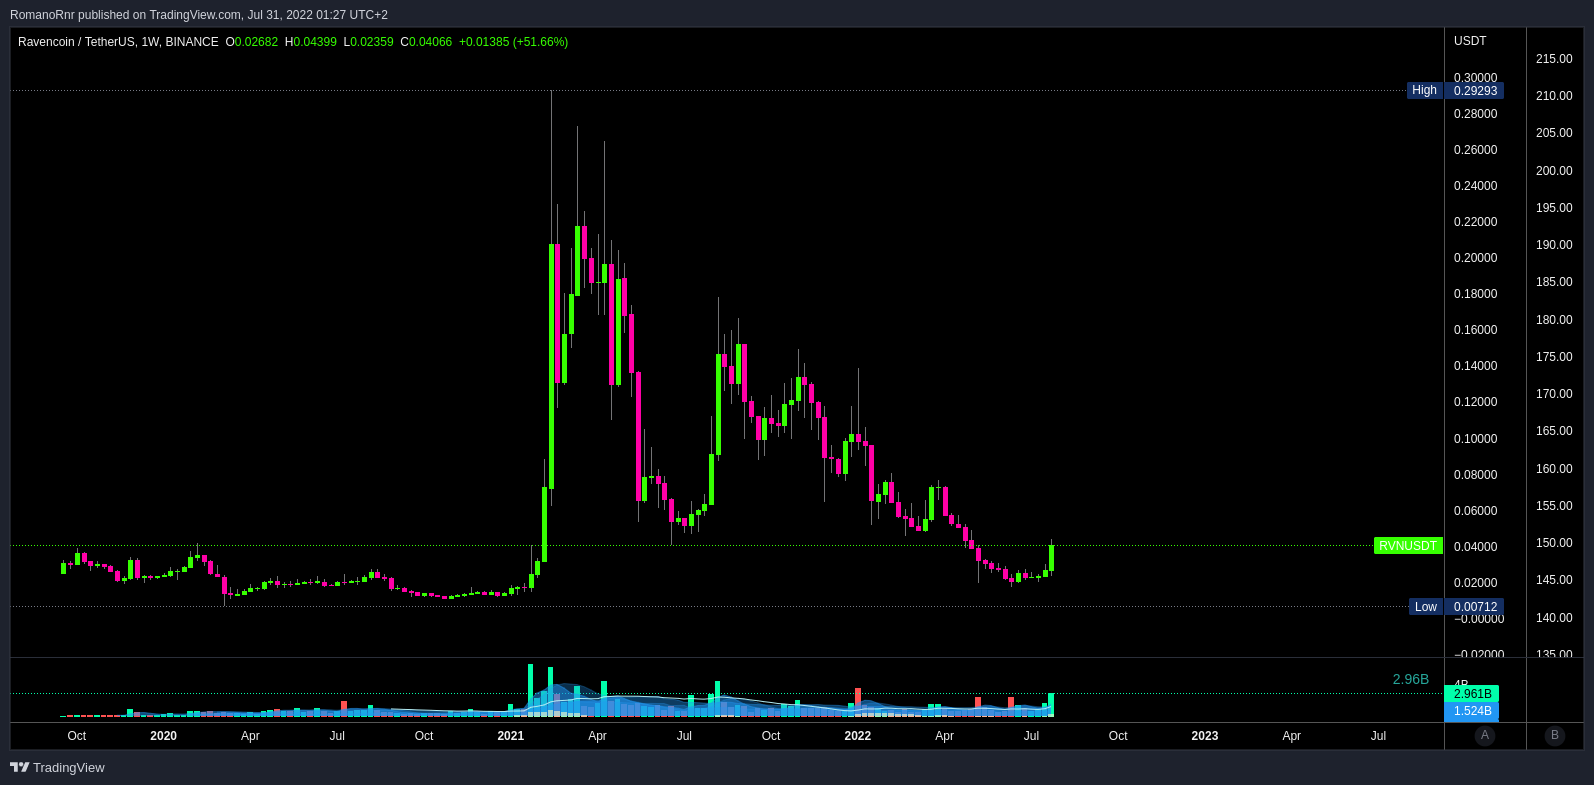
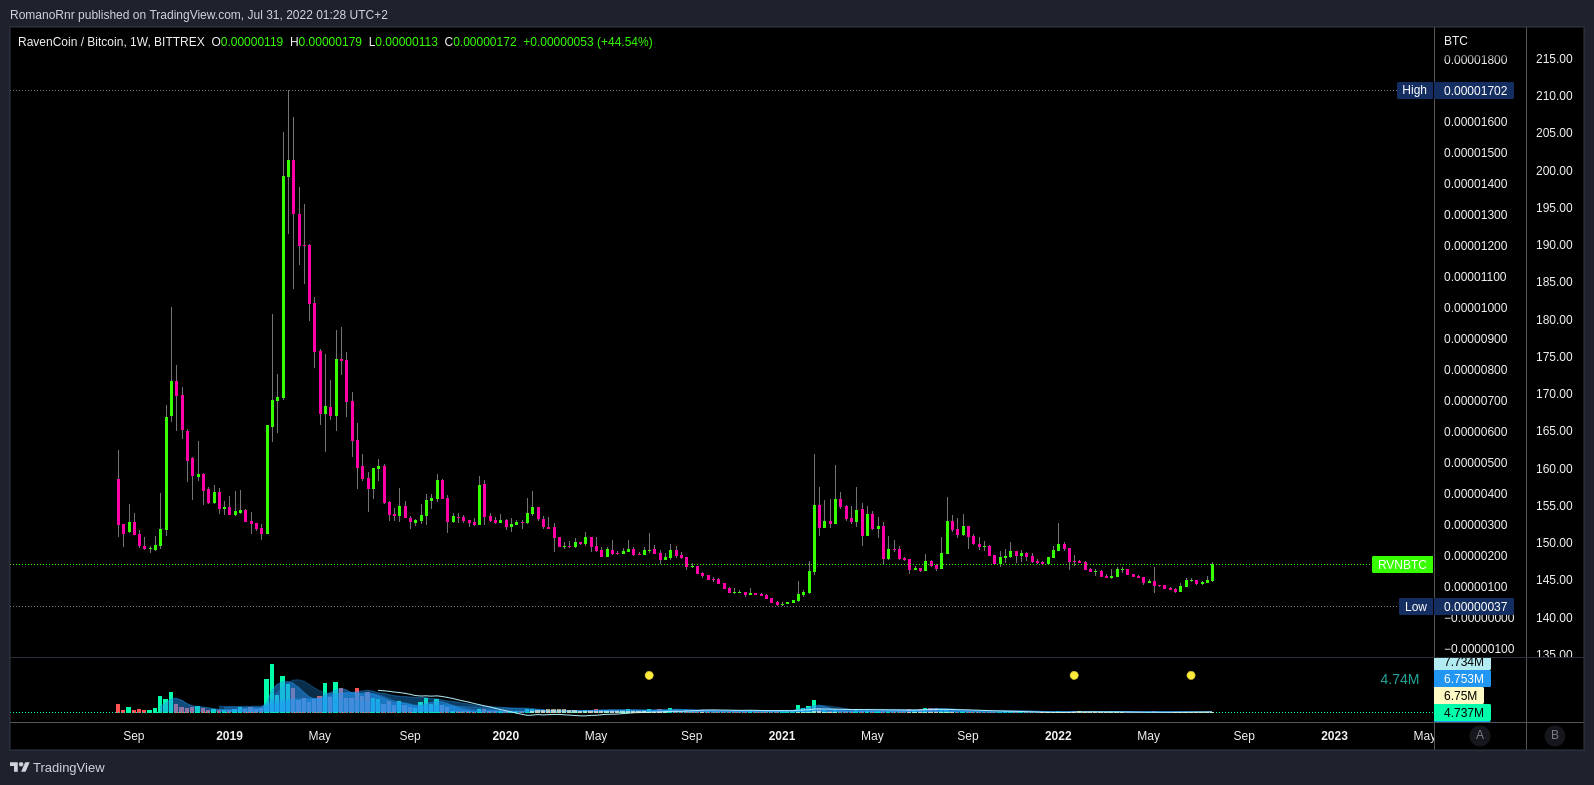
- Ravencoin
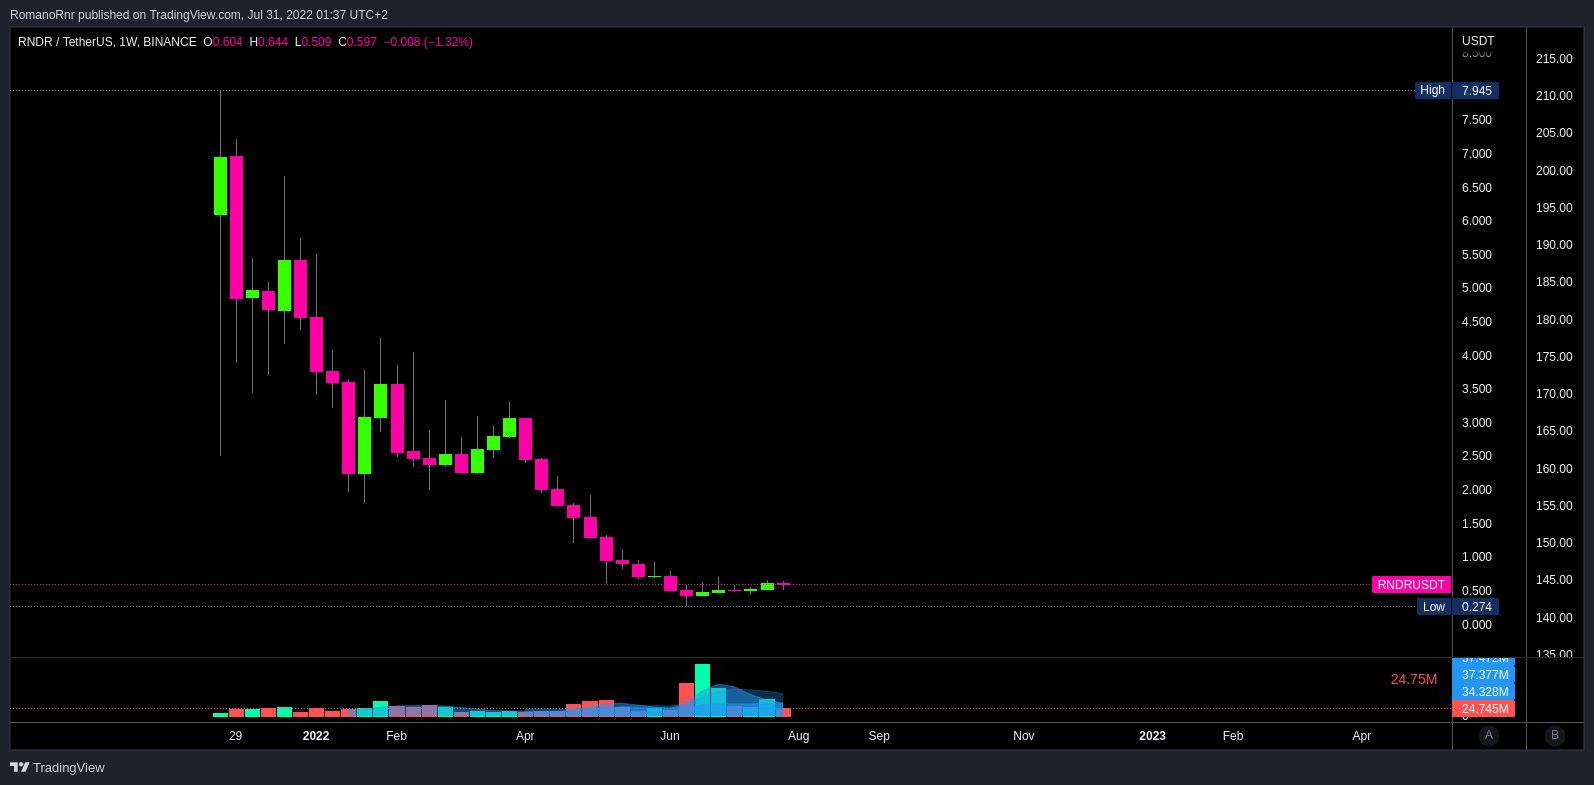
Another token to look at is Render Network.

The Render Network is a decentralized network that allows users with idle GPUs to earn RNDR tokens by rendering jobs for other users. Owners connect their GPUs to the network in order to receive and complete rendering jobs using OctaneRender. Users send RNDR to the individual performing the render work, and OTOY receives a small percentage of RNDR for facilitating the transaction and running the Render Network.
Once they’ve registered their idle GPUs on the Render Network, these GPU owners become “Node Operators” and can earn RNDR Tokens. They do this by accepting jobs from users in need of rendering work, known as “Creators”, who send their files to the Render Network, where they are assigned to Operators. Render receives a small percentage of the RNDR paid out in order to maintain the network and facilitate the transaction.
The Render Network is a decentralized network that allows users with idle GPUs to earn RNDR tokens by rendering jobs for other users. Owners connect their GPUs to the network to receive and complete rendering jobs using OctaneRender. Users send RNDR to the individual performing the render work, and OTOY receives a small percentage of RNDR for facilitating the transaction and running the Render Network.
Once they’ve registered their idle GPUs on the Render Network, these GPU owners become “Node Operators” and are able to earn RNDR Tokens. They do this by accepting jobs from users in need of rendering work, known as “Creators”, who send their files to the Render Network, where they are assigned to Operators. Render receives a small percentage of the RNDR paid out in order to maintain the network and facilitate the transaction.
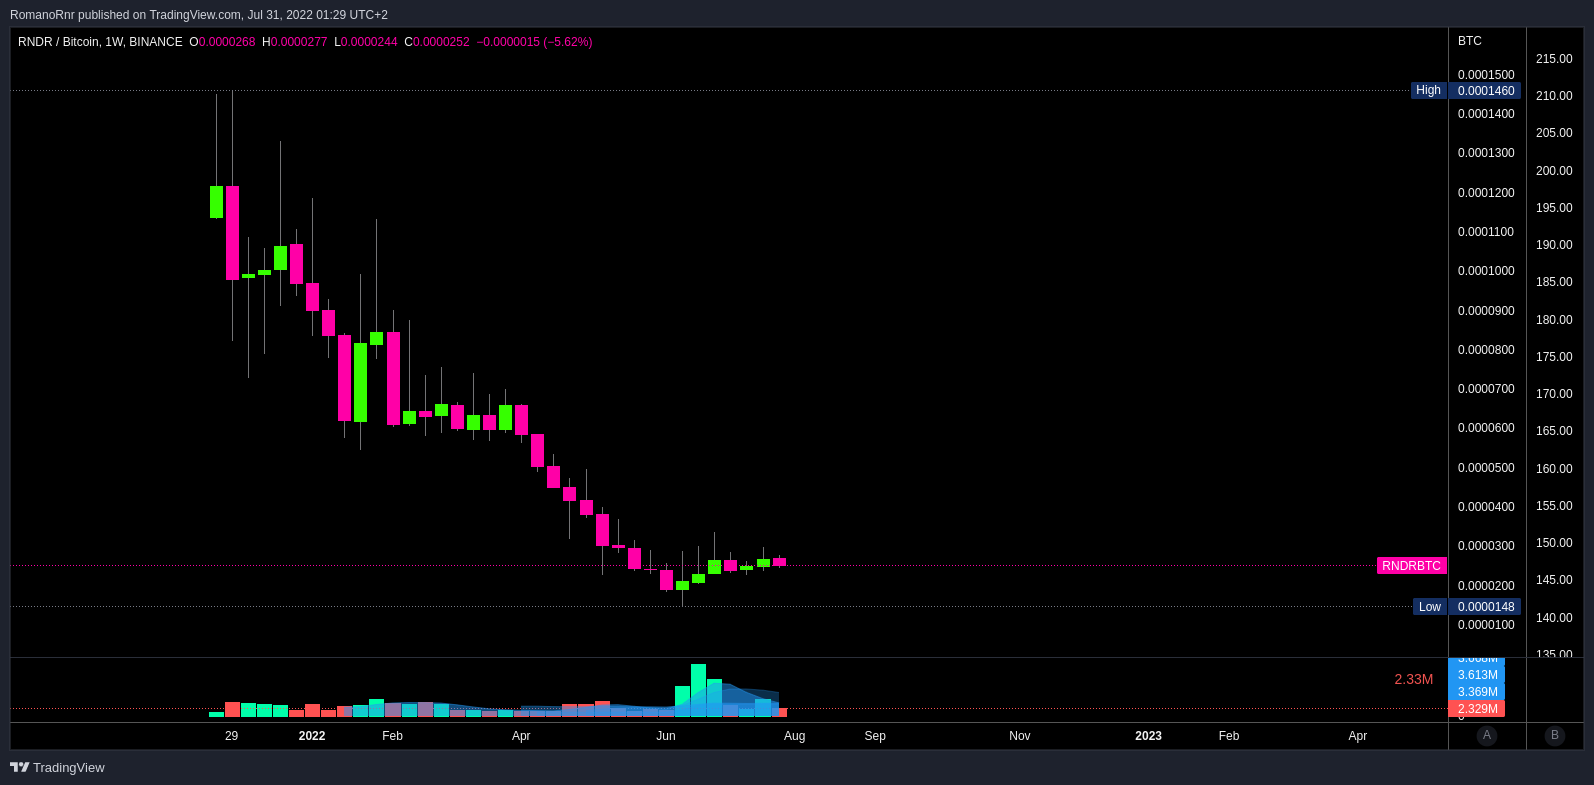
As you may have noticed, I also included the BTC charts of these tokens. It's also important to chart against BTC. Obviously, when BTC price pumps, the dollar price of these tokens may go up but not necessarily against bitcoin. It can paint a false picture of strength if you only chart in USD/USDT.
You can buy these tokens on Binance & FTX
If you don't have a Binance account, 10% discount on fees: https://accounts.binance.com/en/register?ref=XGEU4220
If you don't have an FTX account, 10% discount on fees instead of 5% from other links: https://ftx.com/referrals#a=10percentDiscountOnFees
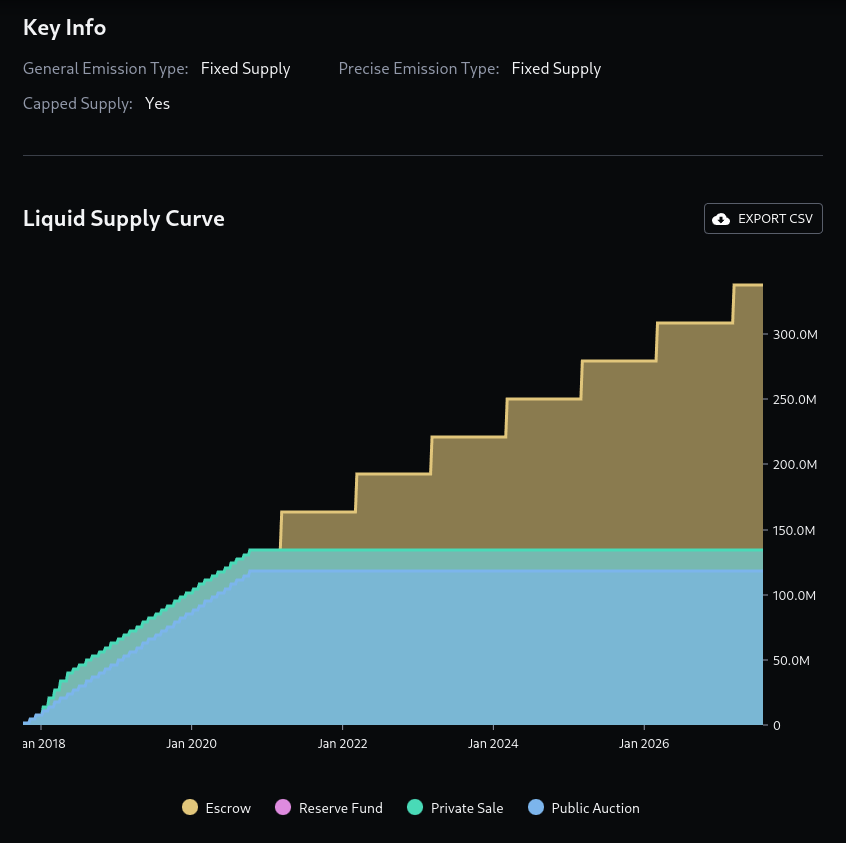
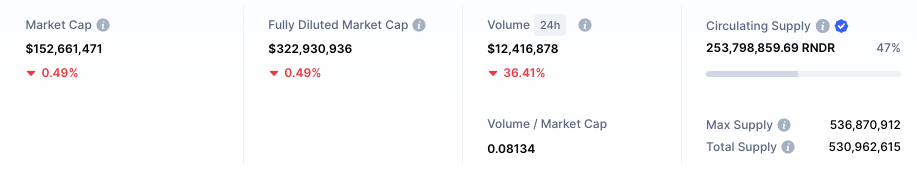
However, it's important to also look at the emission.
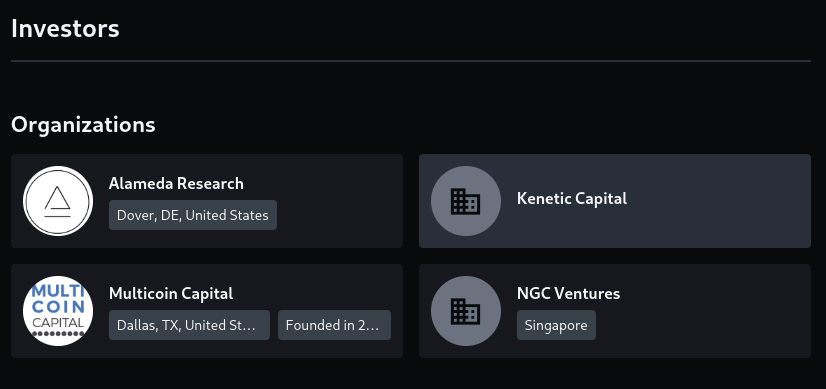
The bad side about Render Network, which probably makes it a bad investment is the investors.
Alameda Research & Multicoin Capital
So far, except for Solana, I think most projects backed by Alameda have lost 90% of their value. Definitely don't go "all-in" on anything, especially not when Alameda backs it.
Because you know Low Float high FDV VC-nomics
A great article about Low Float high FDV VC-nomics

As you may have seen, RNDR started around $7 and dumped all the way to ~$0.28, another classic example Low Float high FDV VC-nomics.
Trap retail investors like you and me into buying them at the launch hype. The emission/inflation kicks in, and prices decline rapidly.