Market insight - 17 Nov 2025
Last Friday was a bit mixed, with the SPX500 falling and then rallying in the last minute. That same pattern looked so familiar, like I've seen many times. Just when one thinks "we are so back" is right where risk should be taken off the table.
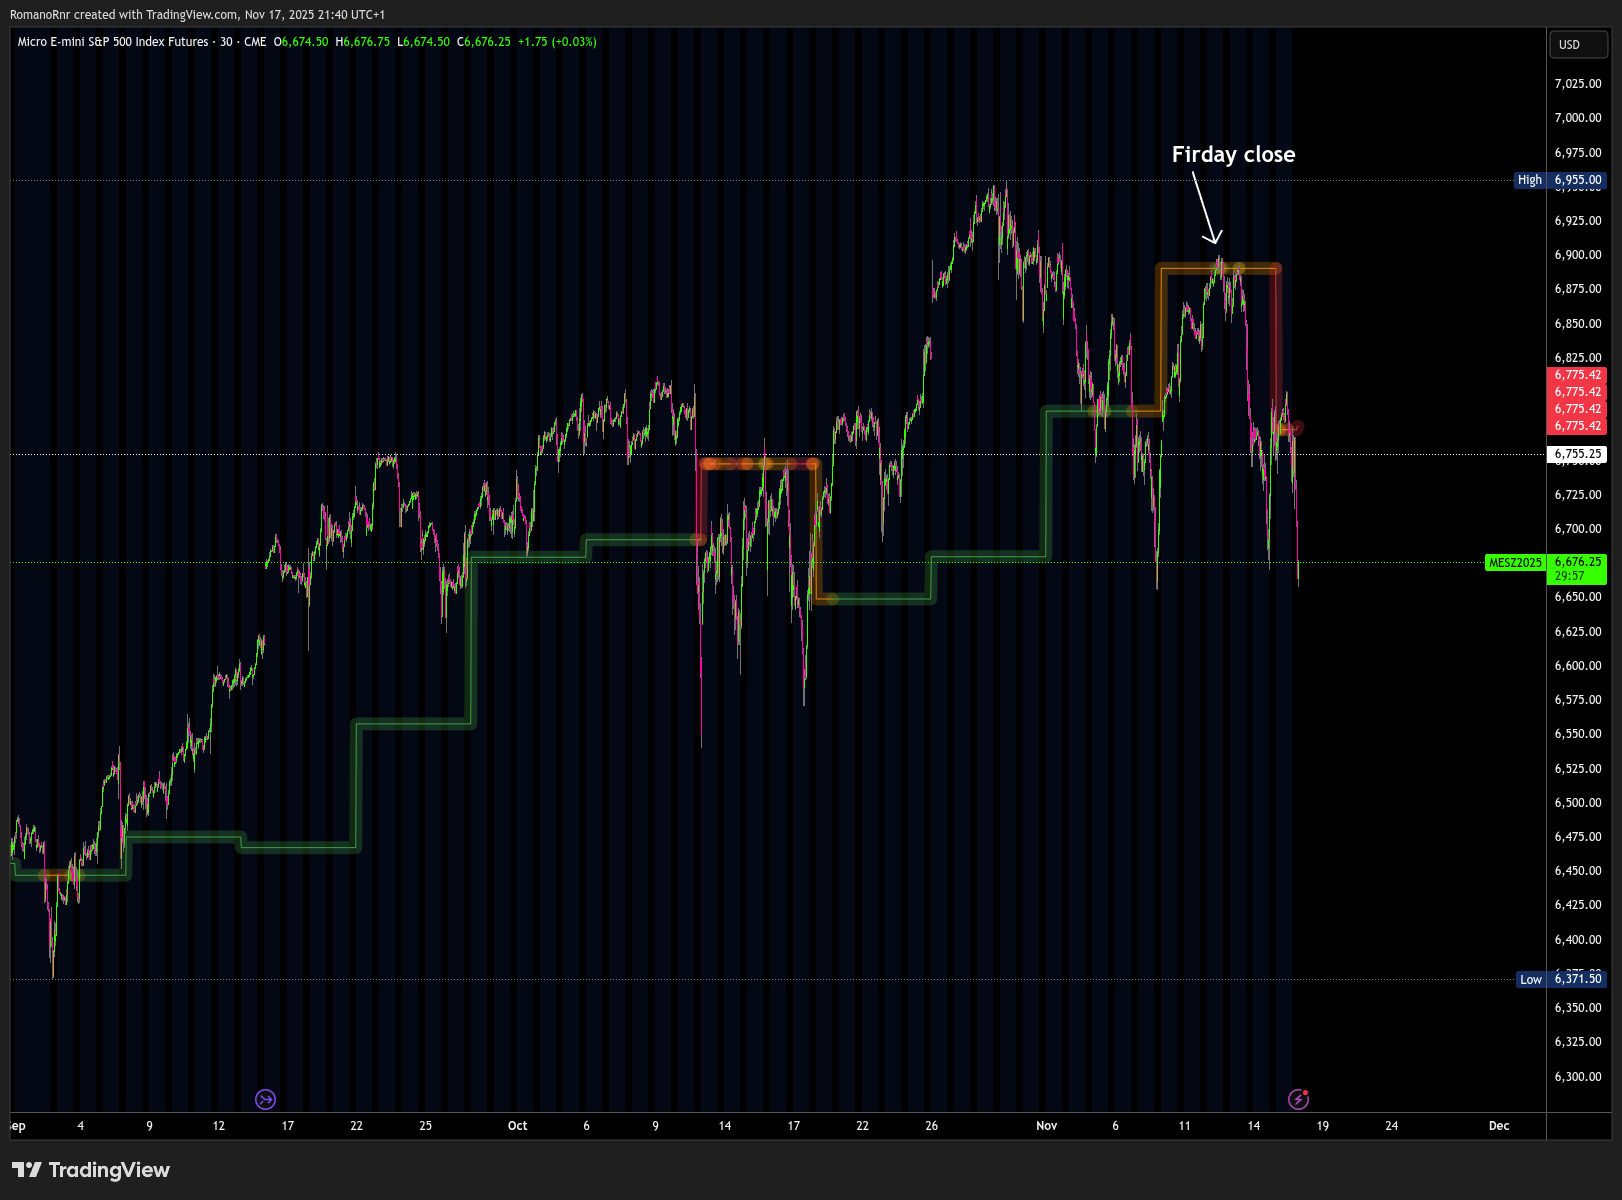
Nasdaq and Dow slipped, too. Investors might be wondering how much of tomorrow's earnings they've already paid today.
Lots of AI names are still priced high, as forward P/Es assume that every dollar of AI spending turns into profit.
Today's article will be a bit different than my usual, more polished articles. This time, I just brain-dumped what I am looking at as I am trying to make sense of it all. (also been super busy lately with my project as December is coming up)
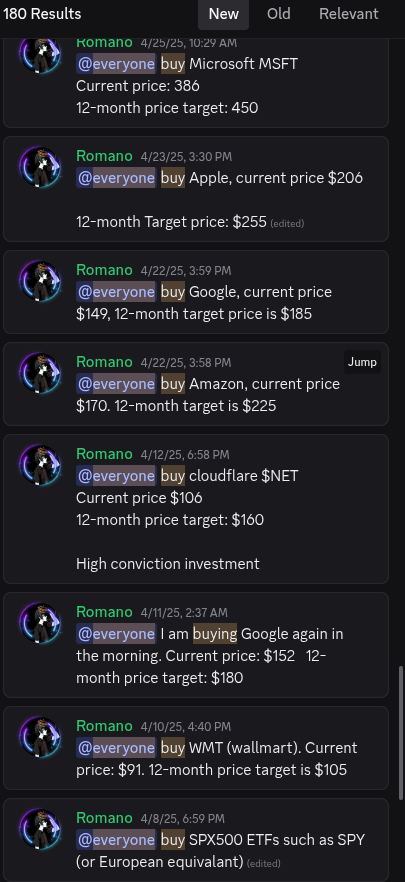
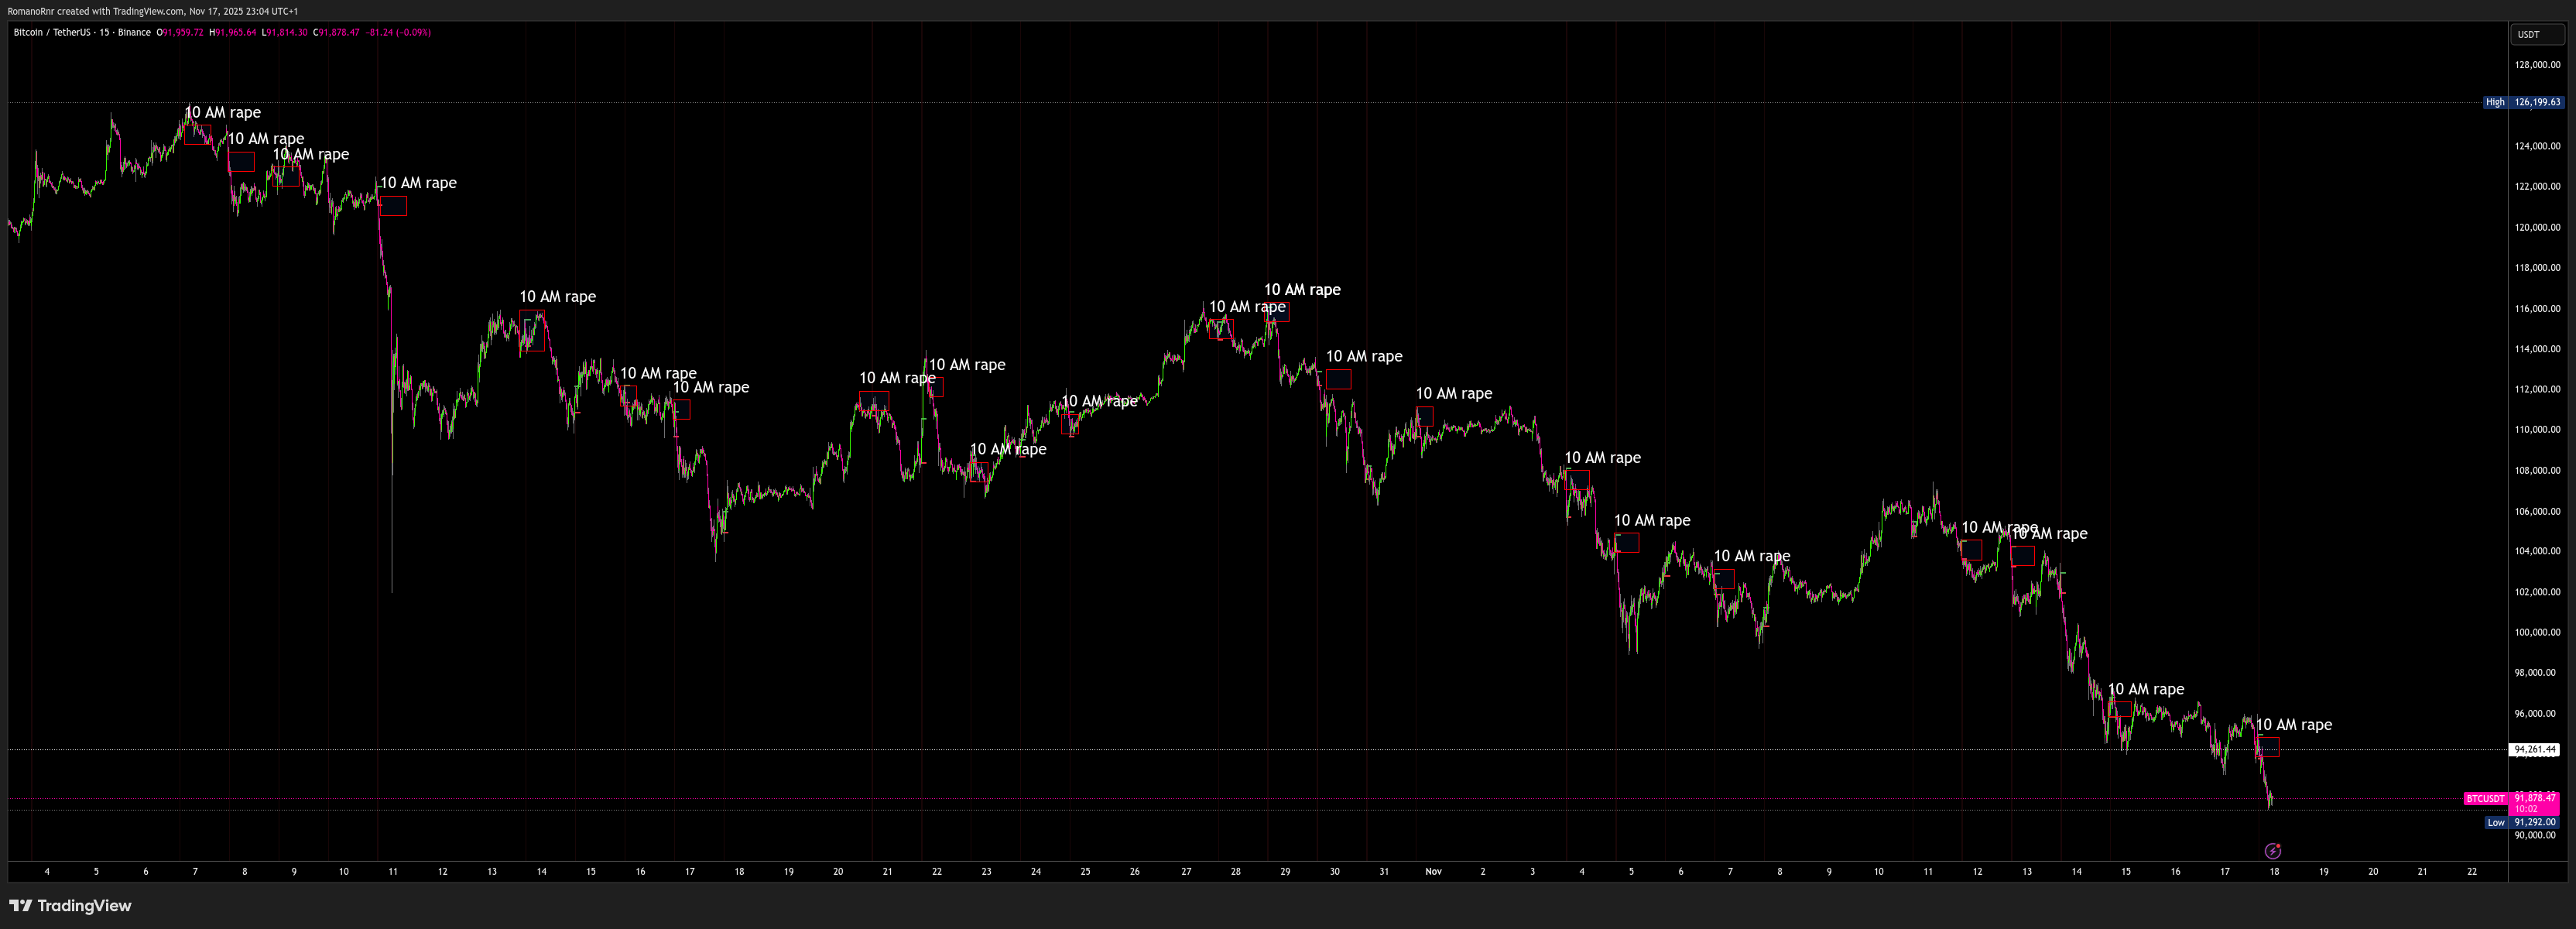
Crypto week summarized:
Honestly, this is looking terrible pic.twitter.com/wB5YdRWYSc
— Romano (@RNR_0) November 13, 2025
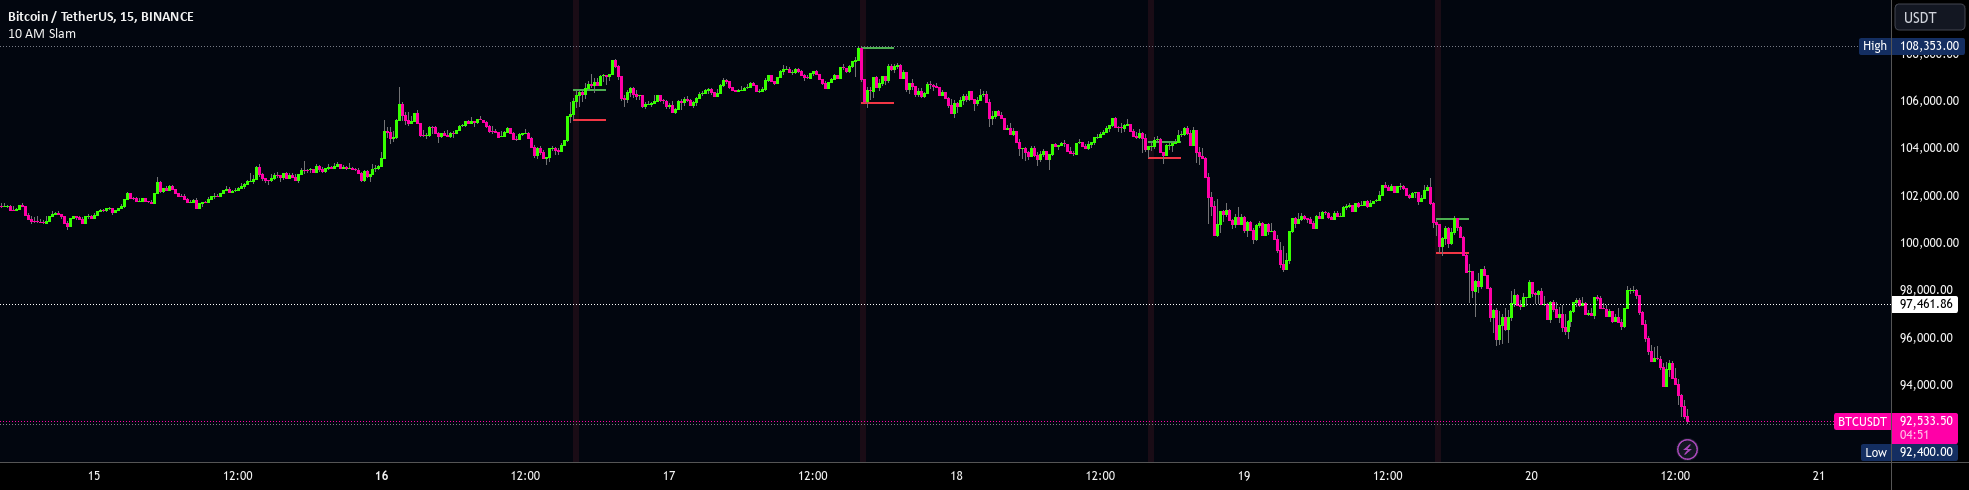
Reminds me, heard about the 10AM SLAM?
For anyone interested in the indicator:
Michael Burry shut down Scion Capital
Michael Burry shut down Scion Capital and said,
My estimation of value in securities is not now, and has not been for some time, in sync with the markets.
Michael Burry dedicated his career to spotting bubbles before they popped. Michael has been skeptical of Nvidia and Palantir, as shown by his 9.2 million bet against them.
While many people mock him, plenty of people have asked themselves whether what they're paying is too high. Consider also how ironic it would be if he closed his fund at the top, just before the big recession began.
Peter Thiel dumped his Nvidia and trimmed Tesla while adding to Microsoft and Apple. Might be a hint of rotation away from high-beta momentum-driven names.
As you may understand, after years of AI rising, I am still somewhat skeptical that this is the absolute top.
Markets did need a pullback, and the Federal Reserve's current pause, along with softening inflation data, is giving equities some breathing room. The days of crazy gains every month, week, and day might be over. Well, that, unless the AI sector pulls another Hail Mary.
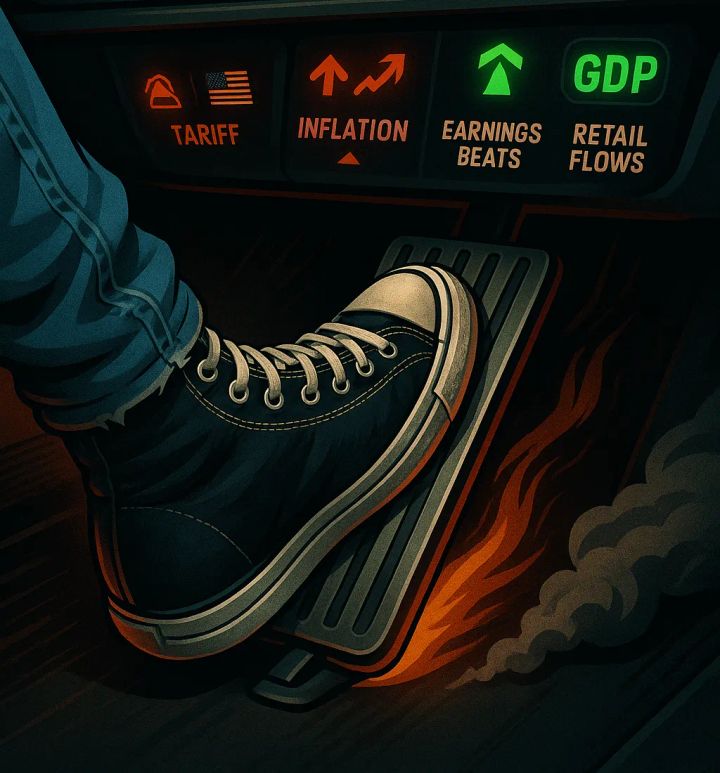
Too many bullish events?
We might have entered a macro environment where the narrative has run miles ahead of reality.
- AI is framed as a once-in-a-generation productivity boom.
- The government is willing to spray and pray money into AI under the pretence of "national security."
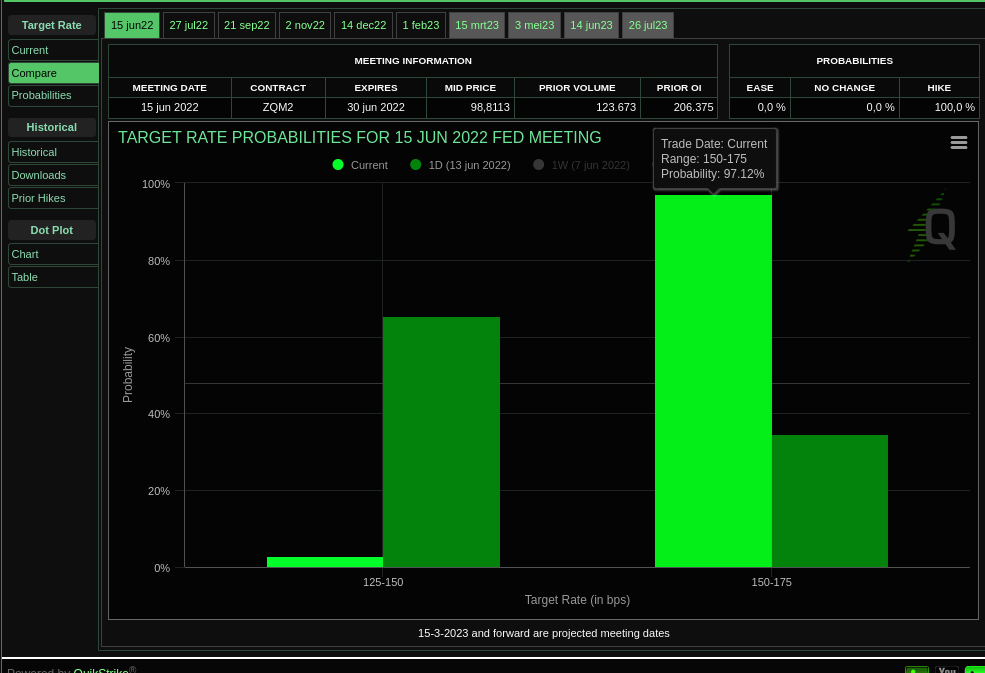
- The Federal Reserve is supposedly ready to cut all-time highs
- Expecting to restart QE in the first half of 2025
- $2000 stimulus checks
Expectations are SO GOOD that it's becoming a problem now. When expectations are unrealistically bullish, equities struggle to rise. It feels like everything good is already "priced in" by now.
A tiny disappointment in growth compresses the multiple. The asymmetry of why perfect is fragile, as Taleb would probably say. Everyone is hedging for the upside, but nobody is hedging for the downside.
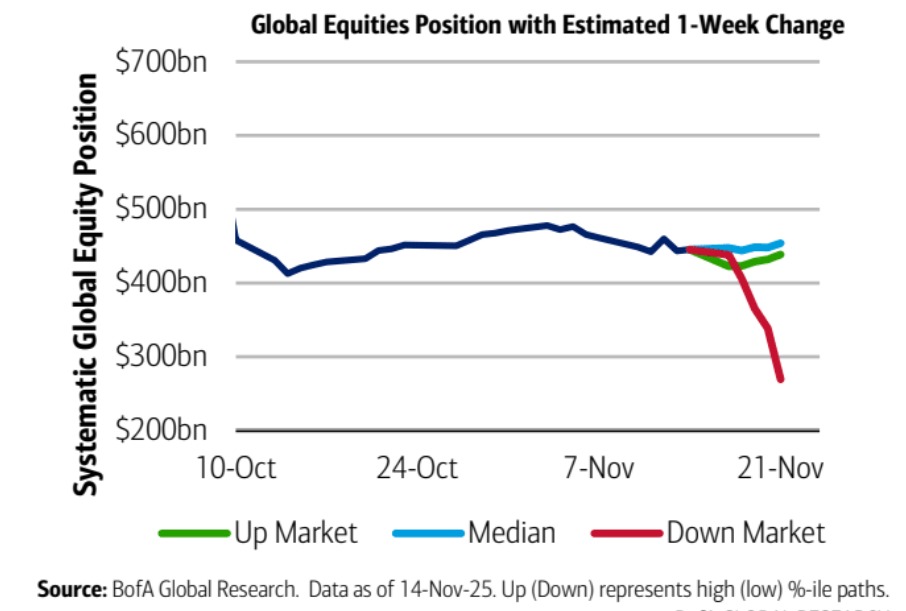
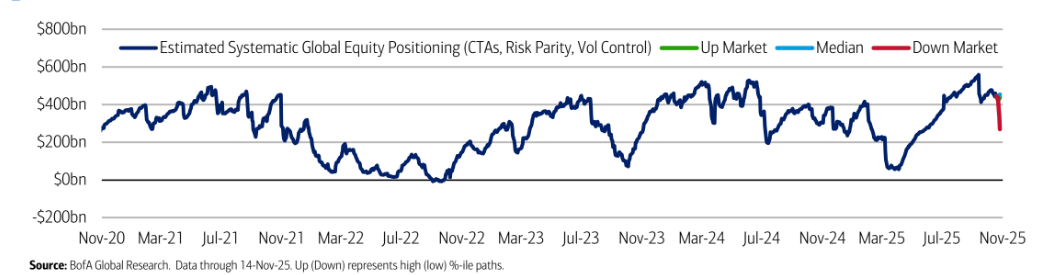
Then there's also positioning. Who's left to buy? No marginal buyer left?
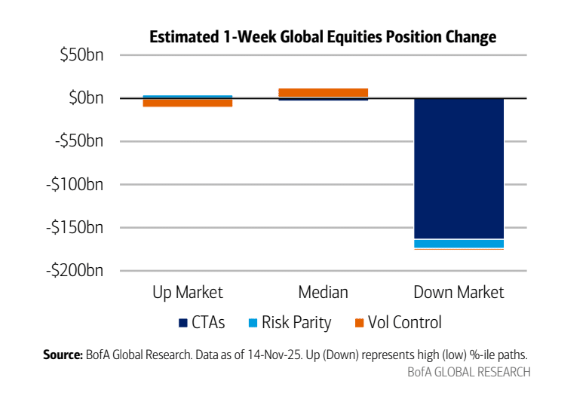
CTAs were max long. Retail is overleveraged. Buybacks are already active. With everyone already "in," the marginal buyer disappears.
• Fed is supposedly ready to cut at all-time highs
— Romano (@RNR_0) November 16, 2025
• expects to restart Quantative Easing in the first half of 2026
• $2000 stimulus checks
• AI is a once in a century productivity boom
• The government willig to spray money in the name of national security
Our bullish…
Even good news doesn't help much more. Any wobble produces asymmetric flows, such as profit-taking and de-risking.
The options market can cap upside, too!
Dealers sell those calls and buy stock to hedge. This supports the way up, as they constantly need to delta-hedge. If the call-buying or spot buying stalls, the options decay/roll off, and the dealer has to reduce their stock to stay delta neutral. Which removes that mechanical bid.
Near highs, implied vols can be low, and short-gamma pockets can flip. A small dip forces dealers to sell into weakness, amplifying pullbacks.

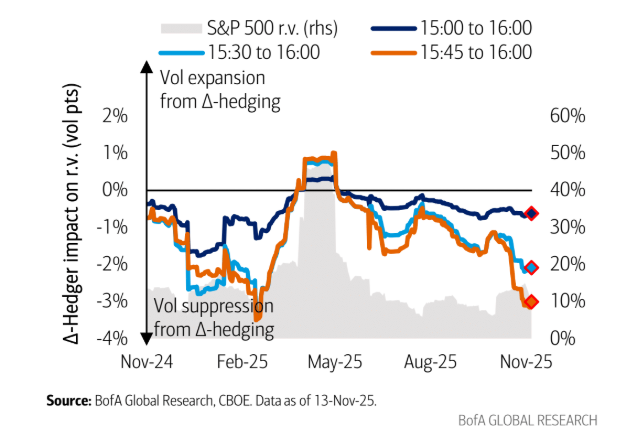
Most of the time (Aug - early Nov and Nov-Feb) the curves sit below zero. At the end of the day, dealer hedging reduced realized vol by 1-3 vol points.
Around May, we see the curve jump above zero. Hedging added ~1 - 2 vol points to realize vol (small expansion regime)
Into November, the suppressive effects deepen again with -2 to -3 vol points while realized vol falls into the low.
Heding is often bunched into the last hour. Risk is measured at close, option books reset, and auction liquidity. Concentrating those flows can shift the realized vol print even if the rest of the day is quiet.
Assuming all my readers are familiar with "long gamma" and short gamma by now. Also, many older articles here explain it well.
Unfamiliar with options? Read my Medium series.

For negative gamma, positive gamma, I recommend reading this older article:
Then there's also VAR, risk parity. Volatility picks up, correlation goes up, and rates reprice. Model cut gross and next exposure right when the market needs new buyers, which reinforces stalls/pullbacks.
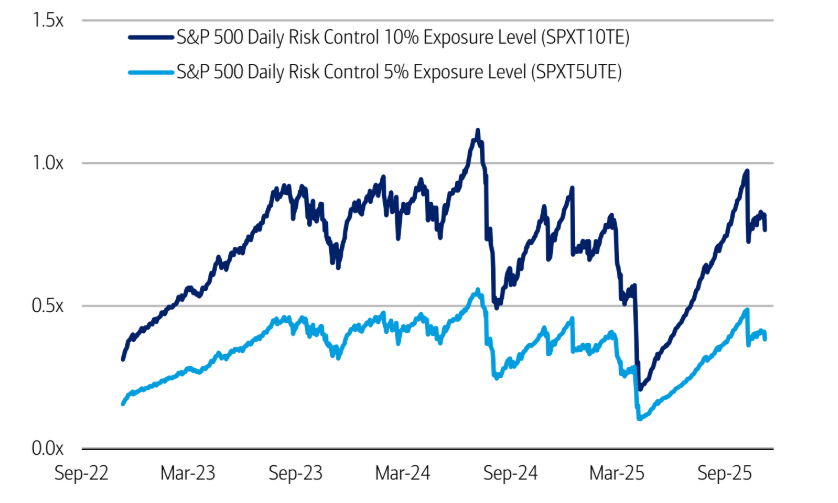
Not to forget Vol Control
Since BTC has been going down, what about gold?
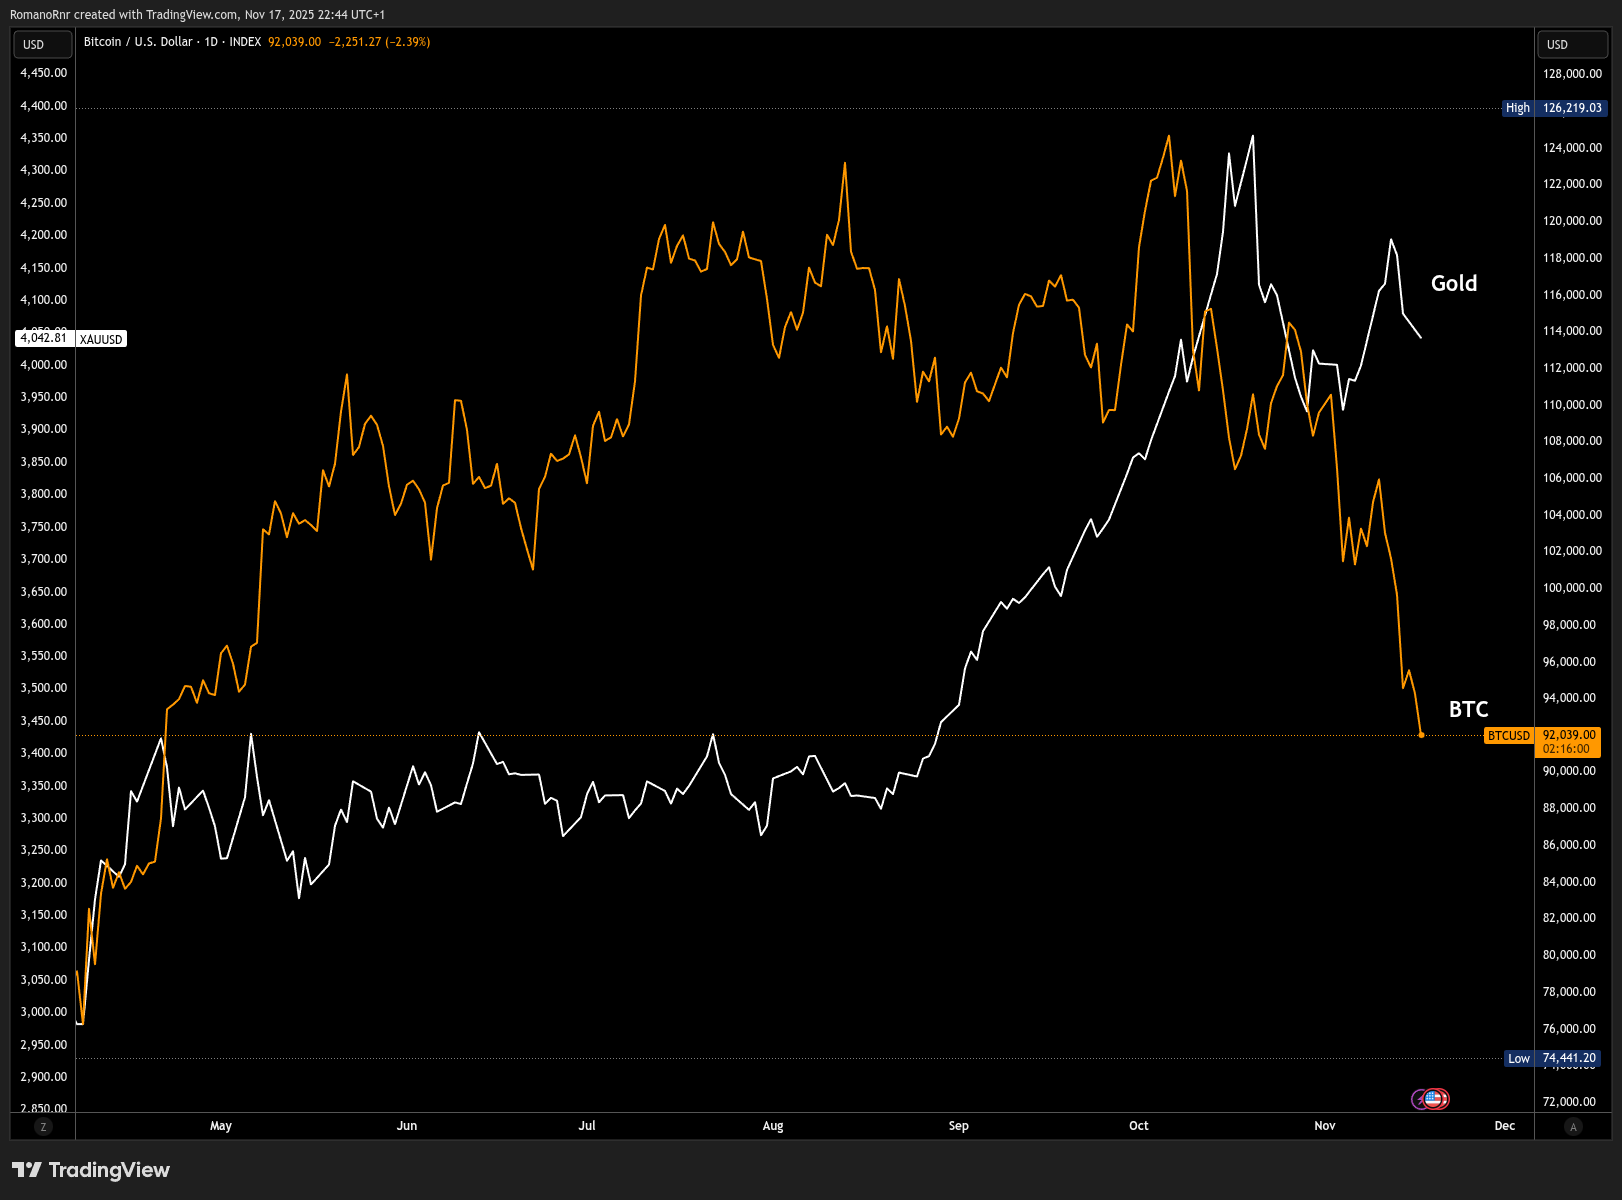
I know, I know the denominator is worthless! But that famous bull quote aside. Who's left to buy once central banks stop buying? Could we see a dip lower?
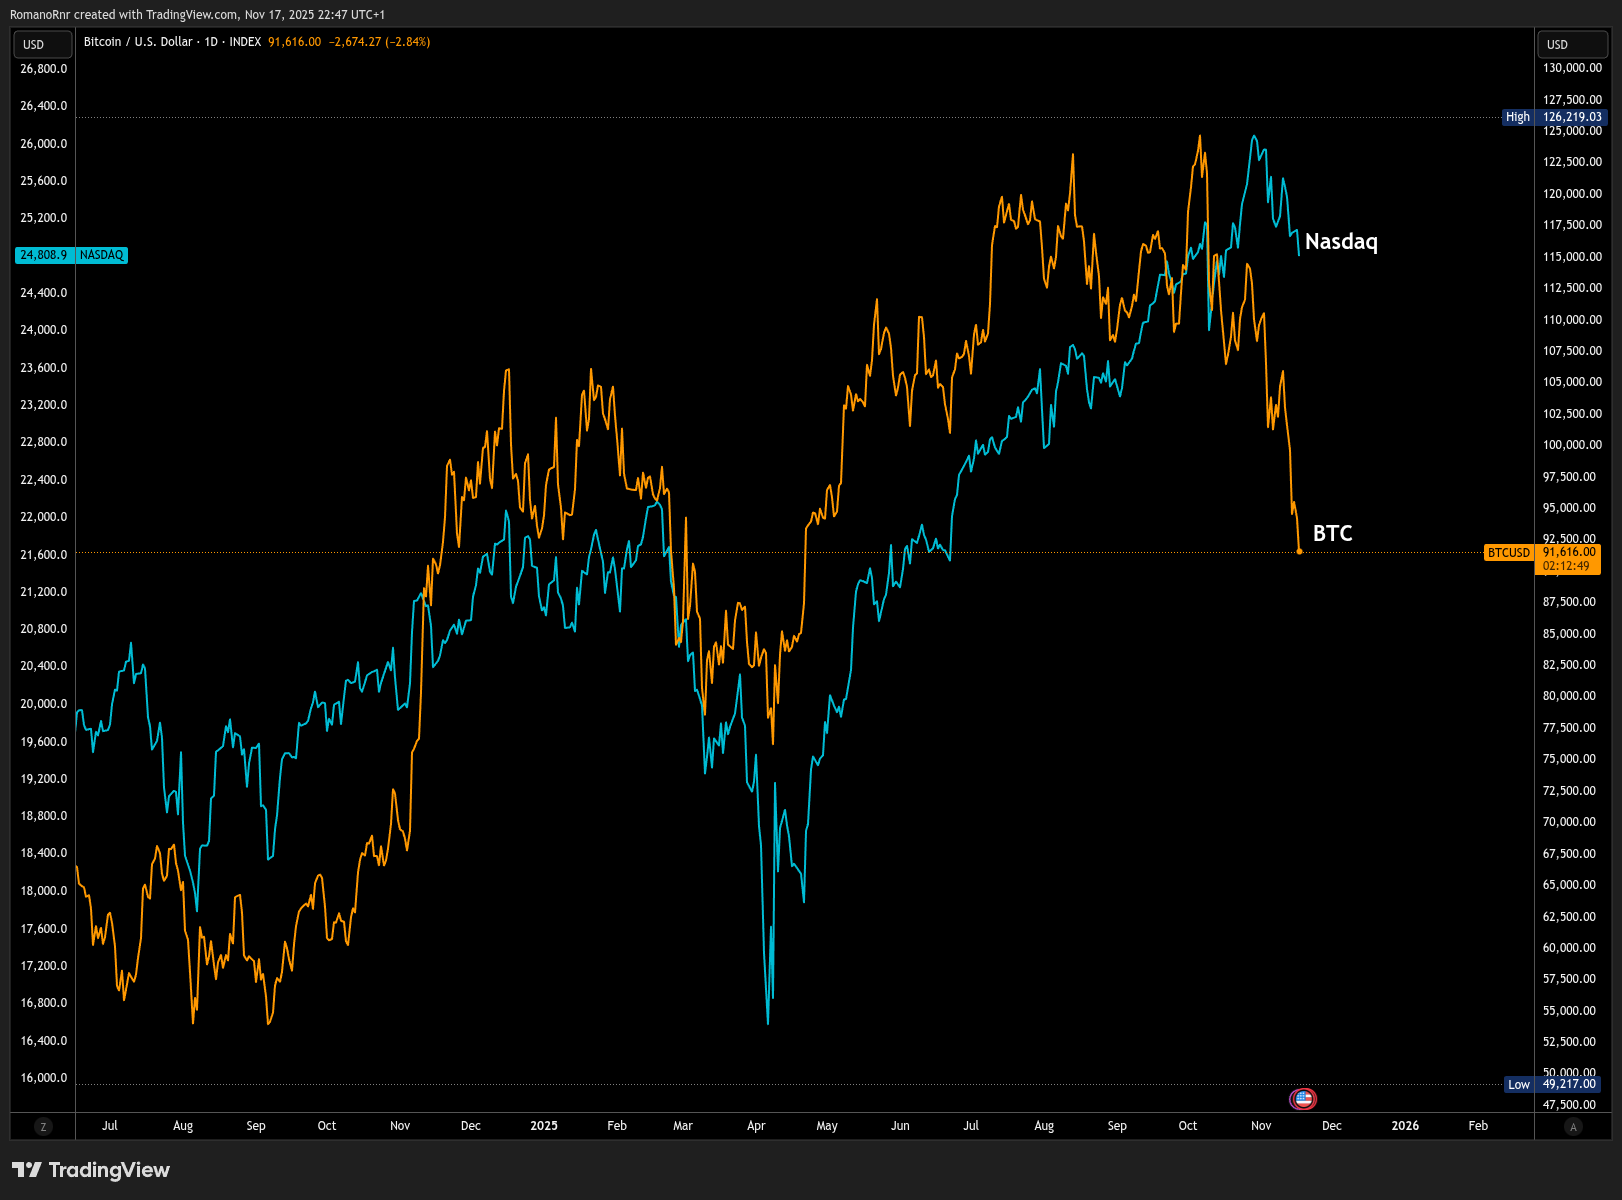
Nasdaq
This also looks uncomfortable. Does Nasdaq has to follow? No. I do know these assets are correlated. Nasdaq still priced too high? Or Bitcoin priced too low?
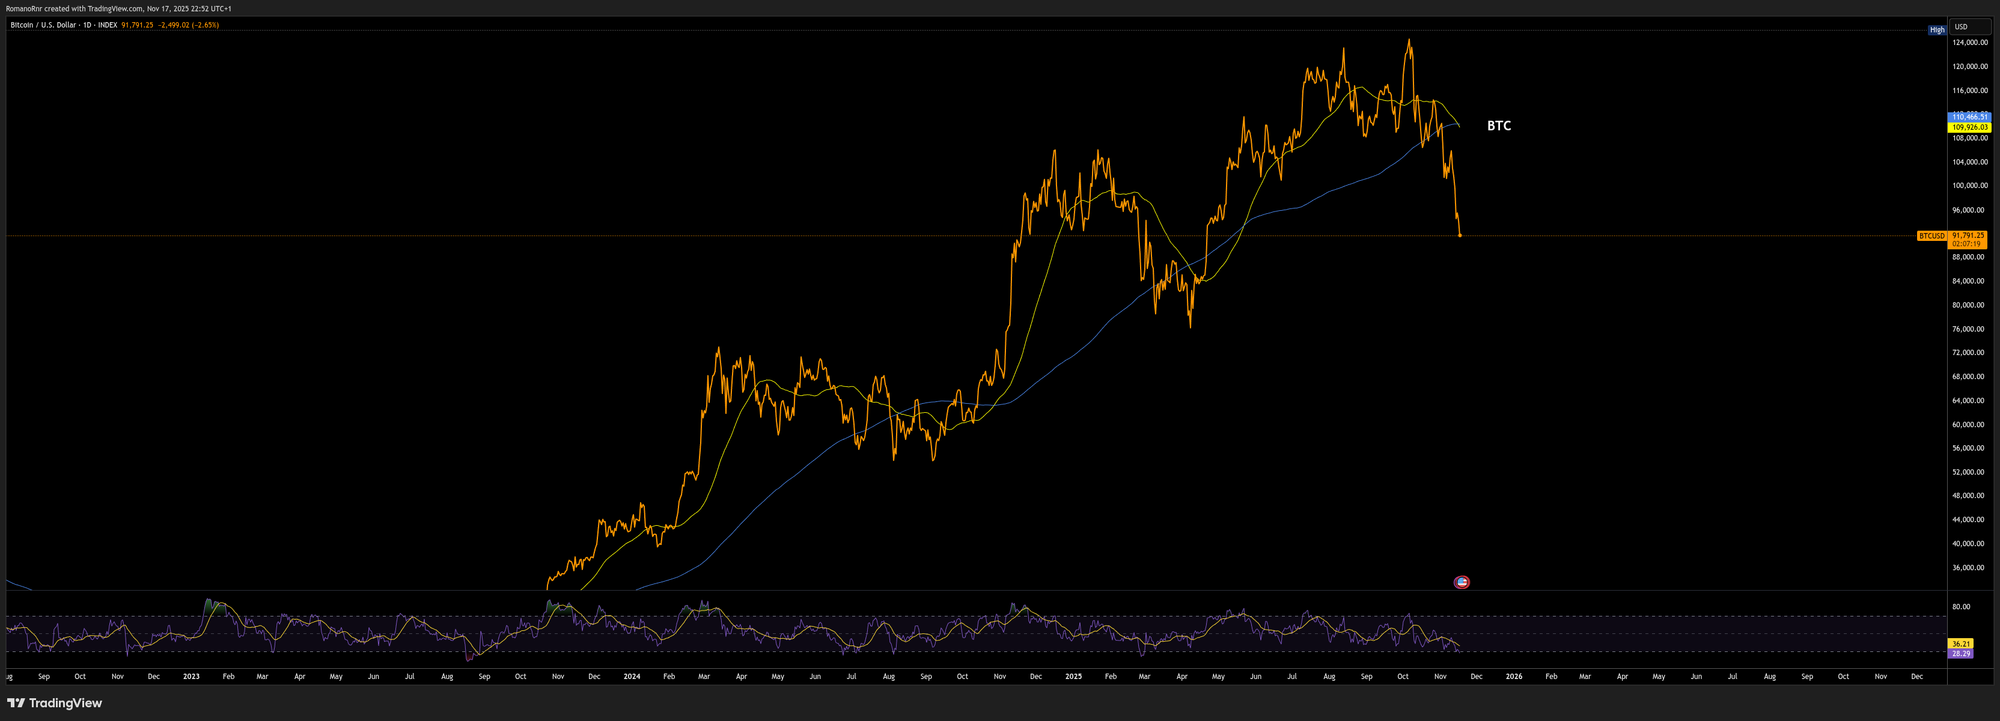
However, I see Bitcoin RSI low being at oversold territory. But that's one nasty death cross on the 200 day and 50-day moving average
Join Discord
Become a Premium member. Premium newsletters & Discord community access